


Ichimoku Technical Analysis Focus:
- US Dollar Index continues to hold power over haven currencies
- Strong moves lower by GBP, EUR to close out April
- Introduction & explanation of Ichimoku Scorecard
Traders are often looking for a clear move regardless of the timeframe on the chart. Naturally, relative tradable breakouts tend to happen on lower time frames like intra-hour or intraday charts such as the 1-4hr time frame.
One of my favorite ways to trade with Ichimoku Cloud is on the one-hour chart. Obviously, I’m looking to enter in the direction of the trend where price is above the cloud in an uptrend or below the cloud in a downtrend.
What determines as to whether I stick in a trade is if the lagging line is also above the cloud in an uptrend or below the cloud in a downtrend on a 60-minute chart.
Want a full (& FREE) guide to walk you through Ichimoku? I created one here
US Dollar Strength Continues
While US Dollar strength has surprised many traders, a technical trader tends to react early and manage risk aggressively. Doing so on US Dollar Index on a one-hour chart with Ichimoku applied would have had you enter long on April 19, a few days after the breakout to ride one of the more aggressive FX moves of the year.
Recommended Reading: US Dollar Index (DXY) Forecast: Pigs Are Getting Slaughtered
US Dollar Index (DXY) Trades To Highest Levels Since January, Broke Out on April 19
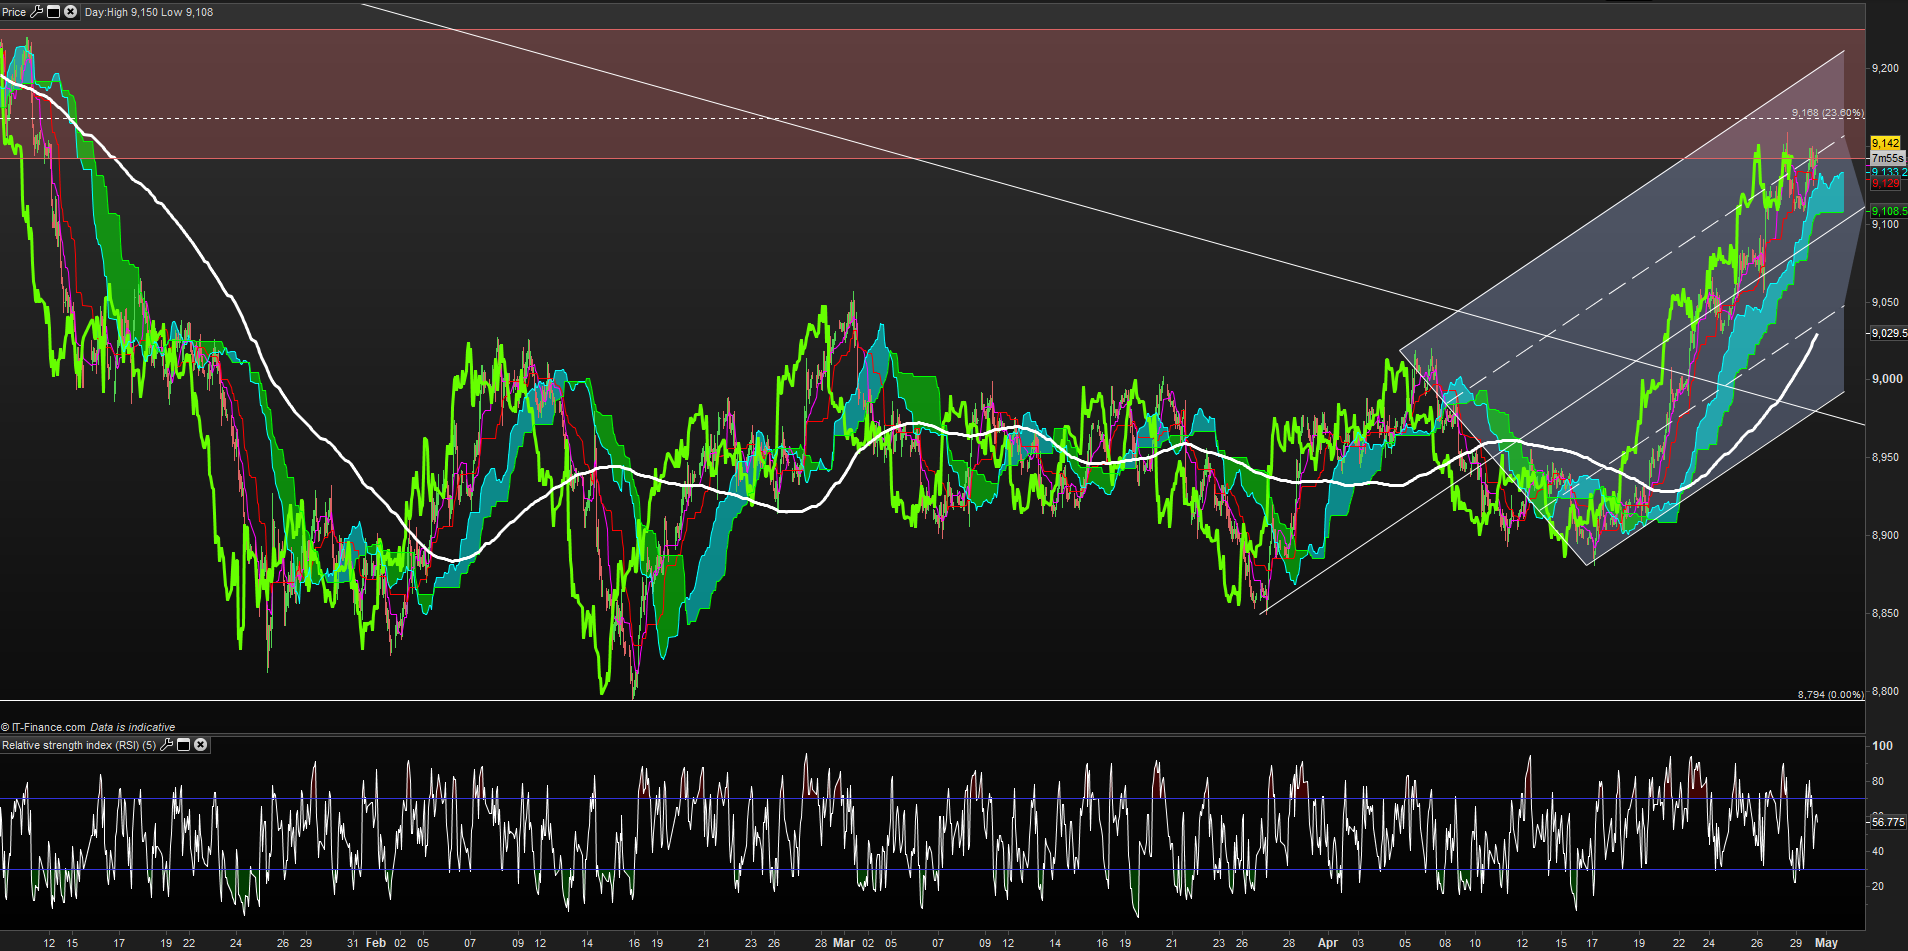
Chart Source: Pro Real Time with IG UK Price Feed. Created by Tyler Yell, CMT
Cable Reversal Saw Initial Move Highlighted By Ichimoku Momentum Reversal against Double-Top Resistance
1.4350 USD per GBP appeared too rich for the market without a definitive note by the Bank of England that they were soon to engage on their own hiking cycle. Now that the May BoE meeting is approaching, the market has continued to discount the potential of a rate hike and Cable is dropping as a result.
Across the G8, Cable is one of the biggest losers despite institutional positioning showing Sterling long positions at a ~4-year high and the aggregate USD short position at a ~6 year high.
Either way, Ichimoku provided an early heads up that a move was underway. Typically, at least in my experience, around 45% of Ichimoku signals go on to make money worth mentioning and depending on the market cycle, sometimes much less. Of course, doesn’t make Ichimoku worthless, it just makes money management critical.
Build confidence in your trading by checking out our popular guide here
On cable, before DXY broke out, Cable broke down on April 19 before falling nearly 4% with institutions now loading into the GBP short trade that could carry the trend further. This isn’t fortune telling as much as it is wave-riding in a world where you don’t, and have little ability, to see how big the wave will get.
Cable Broke Down Ahead of Broader DXY Breakout

Chart Source: Pro Real Time with IG UK Price Feed. Created by Tyler Yell, CMT
Introduction & Explanation of Intraday Ichimoku Scorecard
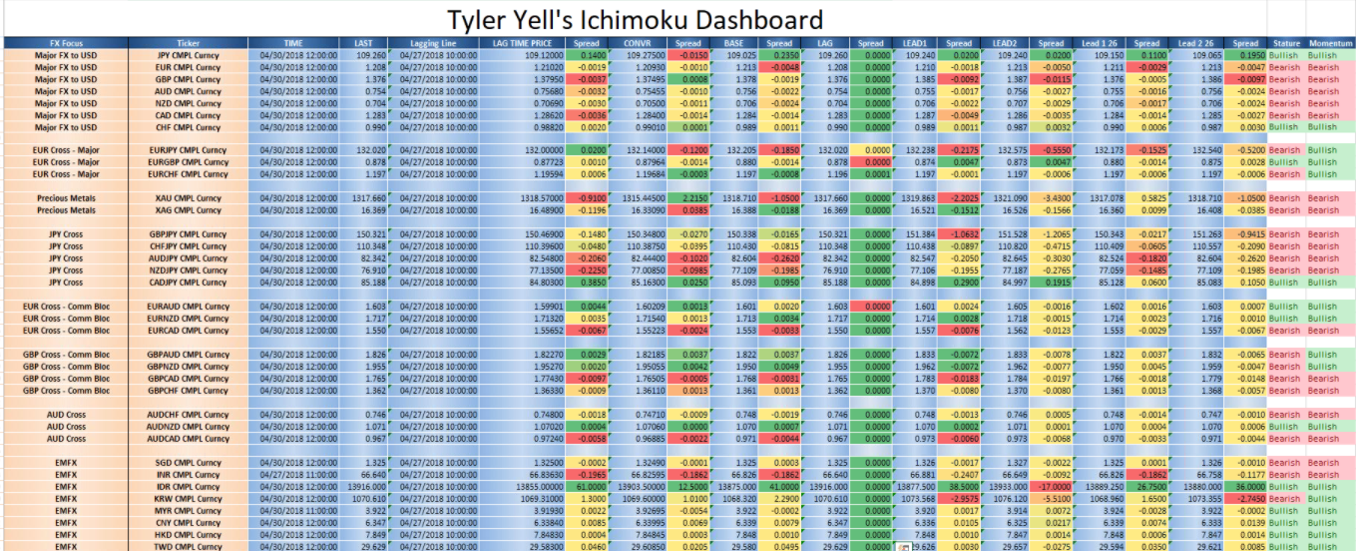
Data source: Bloomberg
Over the last week, I’ve recently found and added insight to an Ichimoku Dashboard put together by Bloomberg. Bloomberg will provide the static levels, but the insight is in the relationship of spot price to components of Ichimoku creating a premium or discount. I call it a spread and when you look at the 60-minute levels above, you can get a broad picture of FX opportunities that show a Bullish Stature and Bullish Momentum (two greens) or Bearish Stature and Bearish Momentum (two reds.)
This chart will be featured on FX Closing Bell and explained with highlighted opportunities as they arise. Of course, if you have questions on using this dashboard, feel free to reach out to me.
Adding to Ichimoku with IG Client Sentiment
Ichimoku has value in helping traders see and trade in the direction of a momentum-backed trend. Retail traders, at least when looked through the lens of IG Client Sentiment, tend to fight strong trends.
We often recommend backing your technical analysis with IG client sentiment as it can do a good job of helping you see sentiment backed moves, which tend to carry on for long periods, which can make for good trades if you’re on the right side.
Insight from IG Client Positioning: Traders are further net-short GBP/USD suggesting DXY may rise further
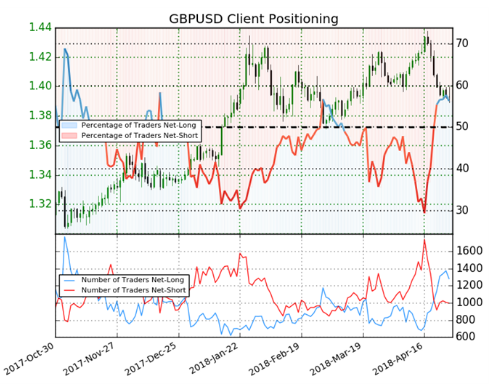
GBP/USD sentiment is analyzed for insight since GBP/USD is a heavily weighted factor of DXY.
We typically take a contrarian view to crowd sentiment, and the fact traders are net-long suggests GBPUSD prices may continue to fall. Traders are further net-long than yesterday and last week, and the combination of current sentiment and recent changes gives us a stronger GBPUSD-bearish contrarian trading bias. (emphasis mine.)
New to FX trading? No worries, we created this guide just for you.
---Written by Tyler Yell, CMT
Tyler Yell is a Chartered Market Technician. Tyler provides Technical analysis that is powered by fundamental factors on key markets as well as t1rading educational resources. Read more of Tyler’s Technical reports via his bio page.
Communicate with Tyler and have your shout below by posting in the comments area. Feel free to include your market views as well.
Discuss this market with Tyler in the live webinar, FX Closing Bell, Weekdays Monday-Thursday at 3 pm ET.
Talk markets on twitter @ForexYell
Join Tyler’s distribution list.


