


US Dollar Index (DXY) Talking Points:
- US Dollar Index Technical Analysis: DXY @ 200-DMA, targets 61.8% Fib of Nov-Feb range at 92.26+
- Specs per the CFTC report pushed curve widening with record short 10Y positions, a strong factor in US Dollar Strength
- Trader Sentiment Highlight from IG UK: jump in GB/USDbullish bias favors further downside
It can be hard to let go of a good idea, such as the US Dollar short trade was in Q1. However, it appears asset managers are having a hard time doing just that. Per the CFTC Commitment of Traders report on data from April 24, Asset Managers held record net EUR & MXN long positions.
Their exposure was ahead of the ECB event that came out from the wash as slightly dovish in absolute terms. However, the rise of AMLO in Mexico as leading in the polls took USD/MXN toward 19.
EUR/USD is holding the 50% retracement now from the November-February range at 1.2055, but a clean breakdown, which USD/SEK higher is favoring would turn focus to 1.1937, the 61.8% retracement of the same range.
EUR/USD Falling, but Holding Up Better Than Most Vs. USD Unwind

Chart Source: Pro Real Time with IG UK Price Feed. Created by Tyler Yell, CMT
Similarly, from a technical perspective, USD/MXN short traders of which Asset Managers are holding a record shot and Leveraged funds are also net-short (long-MXN futures) could be in trouble. So far, the Mexican Peso is closing in on a ~3% loss for April. USD/MXN is currently set to witness an Ichimoku momentum breakout as the lagging line breaks above the cloud after the price found price support at the cloud as well. The key resistance levels are at last week’s high of 19.1575 MXN per USD and the 38.2% retracement of the 2017 price range at 19.2043 MXN per USD.
Not familiar with Ichimoku? You’re not alone and in luck. I created a free guide for you here
USD/MXN is approaching a clean Ichimoku Bullish Breakout
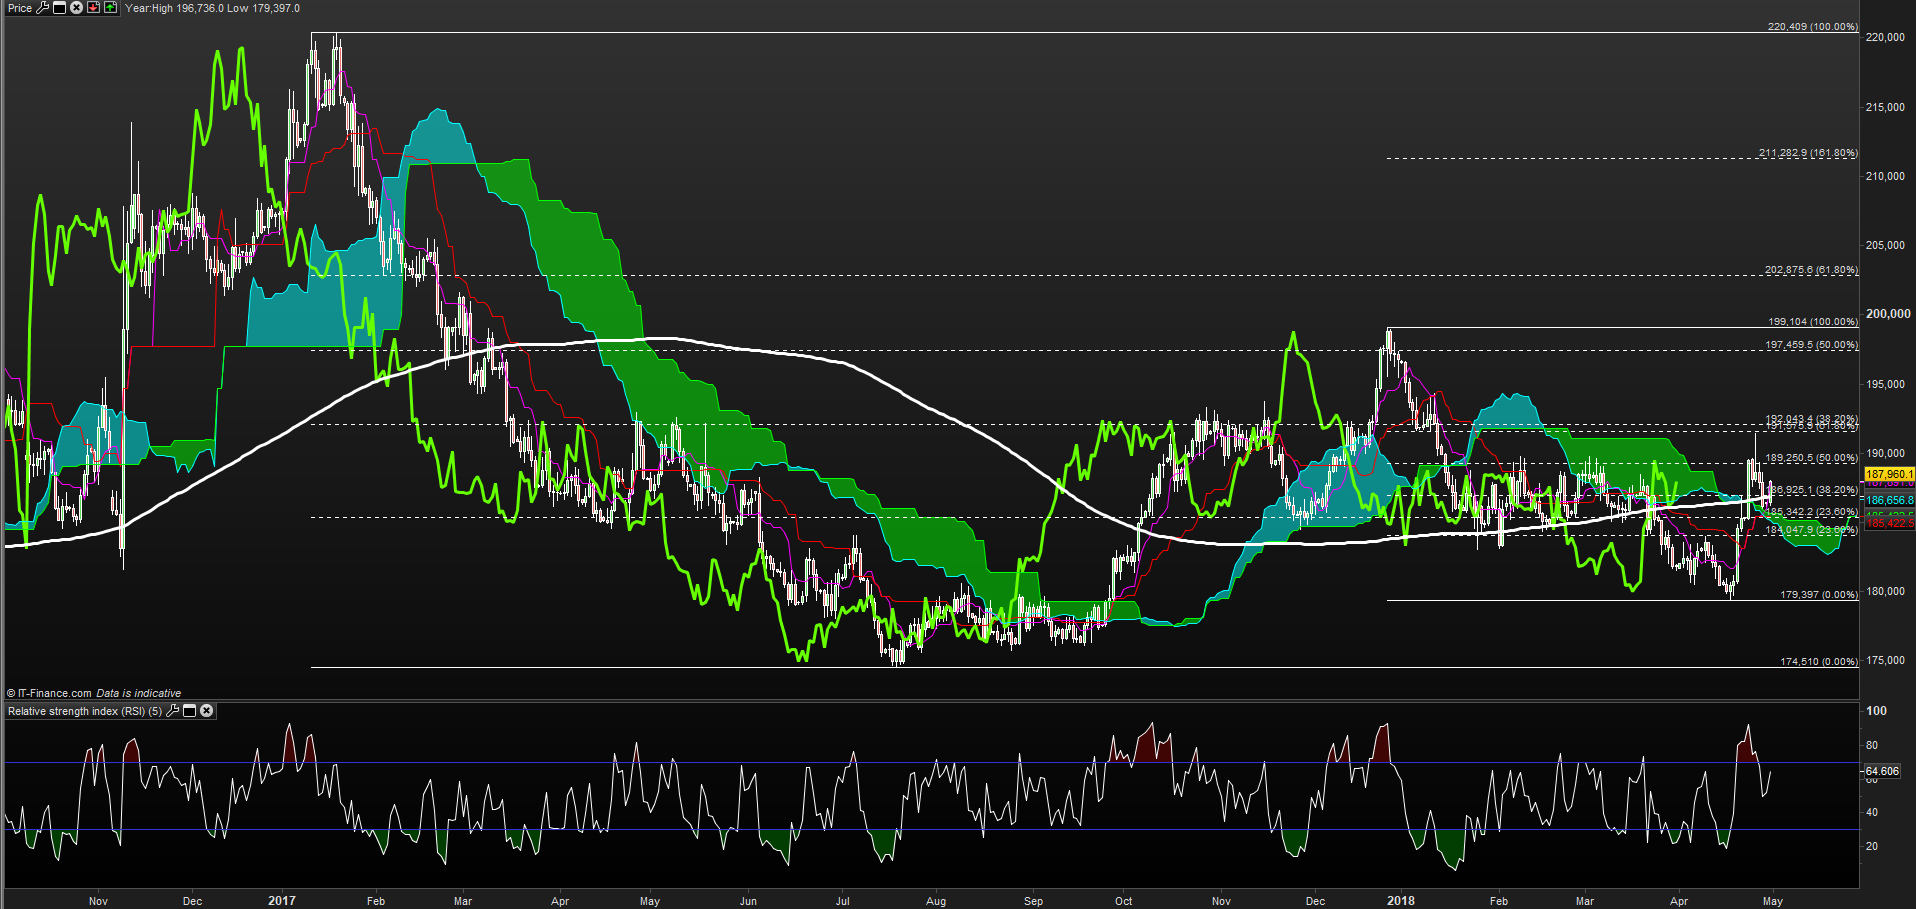
Chart Source: Pro Real Time with IG UK Price Feed. Created by Tyler Yell, CMT
Though spot is currently at 18.8 MXN per USD, a further breakdown in the MXN on political developments seen as impeding capital inflow to the Emerging Market or a broader EMFX sell-off could see the pair reattempt the range encompassing the 50% retracement of the 2017 range to the late 2017 high at 19.7459-19.9104 respectively.
These pairs, EUR/USD & USD/MXN look to be good proxies for the DXY alongside the US Treasury 10Yr yield and the US 2/10 yield spread widening. In absolute terms, there is concern that a Treasury Yield above 3% would dent demand for EMFX assets that are seen as riskier and not worth the yield premium as elections draw near. Additionally, there is a record short position from institutional speculators on the 10Y futures that could widen the UST 2/10 curve further and also drive USD higher against both EUR, MXN, and of course likely the Dollar Index.
Unlock our Q2 forecast to learn what will drive trends for the US Dollar through 2018!
Technical Focus on US Dollar Index: Massive Reversion Underway?
The US Dollar Index is pushing toward the 200-DMA at 91.98, and a breakout higher could cause a further unwind in the massive US Dollar short trade that saw institutions with the largest aggregate position betting on USD weakness in nearly six years.
While there are a few ways to look at price targets, one way is through long-term averages. The 12-month average is currently at 93.15, which, if the US dollar traded up to that level would erase its 2018 loses. The US Dollar Index traded around the down 1of the 12-month average at 90.444 before recently breaking higher.
DXY Technical Update – Daily Chart Shows Breakout with Sights On 92.26

Chart Source: Pro Real Time with IG UK Price Feed. Created by Tyler Yell, CMT
The chart above shows a legitimate breakout on the Daily DXY chart. Now, the technical focus is on the prior corrective zone that is highlighted above to the 38.2% retracement of the 2017-2018 range and the 61.8% retracement of the November-February range at 91.42-92.26.
A break above 92.26 would favor this move as being distinctly different from the late October Ichimoku breakout that lasted but two weeks before turning over. A look at other pairs like USD/SEK, AUD/USD, USD/JPY and GBP/USD seem to show momentum is joining the US Dollar upside.
Given the stretched nature of the move, and the heavy data calendar this week, traders shouldn’t be alarmed on a pull-back that holds above the 100-DMA at 90.625 on a closing basis. A move below there would warrant closer inspection.
Recommended Reading: 4 Effective Trading Indicators Every Trader Should Know
Insight from IG Client Positioning: Traders are further net-short GBP/USD suggesting DXY may rise further

GBP/USD sentiment is analyzed for insight since GBP/USD is a heavily weighted factor of DXY.
We typically take a contrarian view to crowd sentiment, and the fact traders are net-long suggests GBPUSD prices may continue to fall. Traders are further net-long than yesterday and last week, and the combination of current sentiment and recent changes gives us a stronger GBPUSD-bearish contrarian trading bias. (emphasis mine.)
New to FX trading? No worries, we created this guide just for you.
---Written by Tyler Yell, CMT
Tyler Yell is a Chartered Market Technician. Tyler provides Technical analysis that is powered by fundamental factors on key markets as well as t1rading educational resources. Read more of Tyler’s Technical reports via his bio page.
Communicate with Tyler and have your shout below by posting in the comments area. Feel free to include your market views as well.
Discuss this market with Tyler in the live webinar, FX Closing Bell, Weekdays Monday-Thursday at 3 pm ET.
Talk markets on twitter @ForexYell
Join Tyler’s distribution list.


