


Talking Points:
- Crude Oil Technical Strategy: price below support turns focus on history of 200-DMA bounce
- Crude Oil Nails Trendline; This is a Big Level
- Dollar direction along with rates expected to be important determinant of Oil going forward
- US Stockpiles Show inventory draw for the first time since December
Here is a positive correlation you should know about. Before Crude Oil broke down and traded below the 200-DMA ($48.65 as of 3/15/17), Oil and Gas Energy & Exploration stocks had broken down and appear to be leading Oil, so it continues to be worth watching. The rolling 20-day correlation for Crude Oil forward contract and the S&P Oil Producer Index is +.598 as of March 15, which is significant. An ETF you can watch is the SPXR S&P Oil & Gas Exploration and Production ETF (XOP).
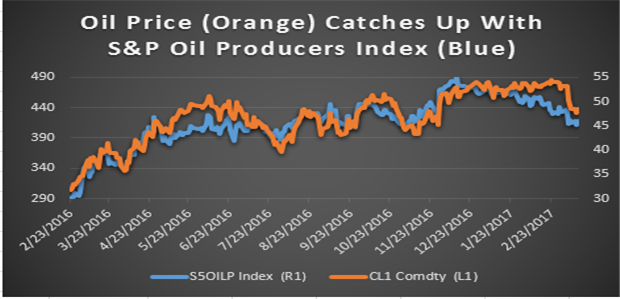
Data Source: Bloomberg
Crude Oil Overlaid (Red Line) With XOP ETF
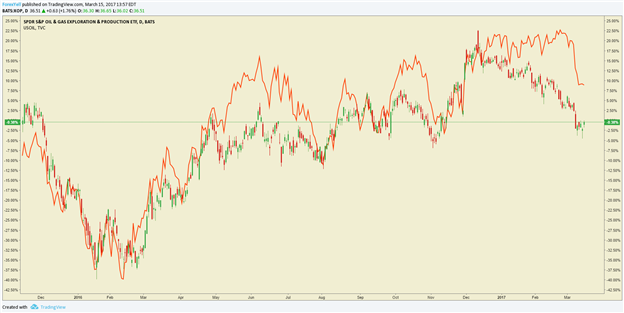
Data Source: TradingView
On Wednesday before the FOMC announcement, the IEA showed that U.S. crude inventories fell by 237,000 barrels, which was the first weekly decline since December and bucks the trend of rising stockpiles and rising Baker Hughes Rig Count from Friday afternoon. Should the trend truly break where we see further inventory draws on Wednesday, we could find the price of Crude supported as well.
Interested in Joining Our Analysts, Instructors, or Strategists For a Free Webinar? Register Here
CRUDE OIL TECHNICAL ANALYSIS – The longer-term view of Crude going back to mid-2015 can help us see where we should focus on possible price support if buying pressure does not arise. Despite Crude Oil having stretched Bearish momentum, we have not yet seen significant buying campaign. Additionally, if you have been watching the Commitment of Traders report, you will remember that a lot of the buying pressure from hedge funds has been supporting Crude Oil for the last few months.
The recent drop in price could be due to hedge funds getting out of the market, which begs the question, what would cause theme to re-enter the market? It’s fair to think it may require a shift in the supply-demand imbalance despite OPEC’s recent efforts as the average US Crude Stockpiles have gained steadily due to Shale production. Hedge funds are likely to require much lower prices before accumulation begins again or a shock higher in Bullish Momentum, which has currently vanished.
The price zone in focus if we continue to see price declines is the area encompassing the 38.2-50% retracement of the February-January price range that also houses the November low and the Median Line of Andrew’s Pitchfork drawn off the key pivots in mid-2015 through February. The zone is $44/$40.57. Naturally, a break back above the 200-DMA that aligns with USD-weakness (CL1 to DXY 20-day correlation is -.256) would help turn the focus higher toward the $55/57 zone.
The price of Crude Oil recently traded below the 200-DMA with RSI(5) registering a bearish extreme. If the price pops higher as it did in April, August, and November of last year, the Bulls may feel as though they’ve dodged a bullet. However, the Crude Oil market doesn’t have the fundamental support that other commodity sectors like base metals have, which could lead to an eventual breakdown toward the November low of $43.75/42.25.
While such a breakdown would hurt, price holding above the November low could indicate a longer-term consolidation lasting much of the year, which is when larger-range Fibonacci Retracement is best used. Either an immediate move back above the 200-DMA or hold of the November low would keep a neutral market still anticipating an eventual move back toward the upper $50/bbl region.
A breakdown below the November low would complement the Bull’s fear of a longer-term topping pattern before a new attempt at $low-30 or 20/bbl, though I do not take that view until we break the November low.
Are commodity prices matching DailyFX forecasts so far in 2017? Find out here !

Chart created using TradingView
--- Written by Tyler Yell, CMT, Currency Analyst & Trading Instructor for DailyFX.com
Key Levels Over the Next 48-hrs of Trading as of Wednesday, March 15, 2017

For those interested in shorter-term levels of focus than the ones above, these levels signal important potential pivot levels over the next 48-hours of trading.
Contact and follow Tyler on Twitter: @ForexYell


