


Daily (LOG)
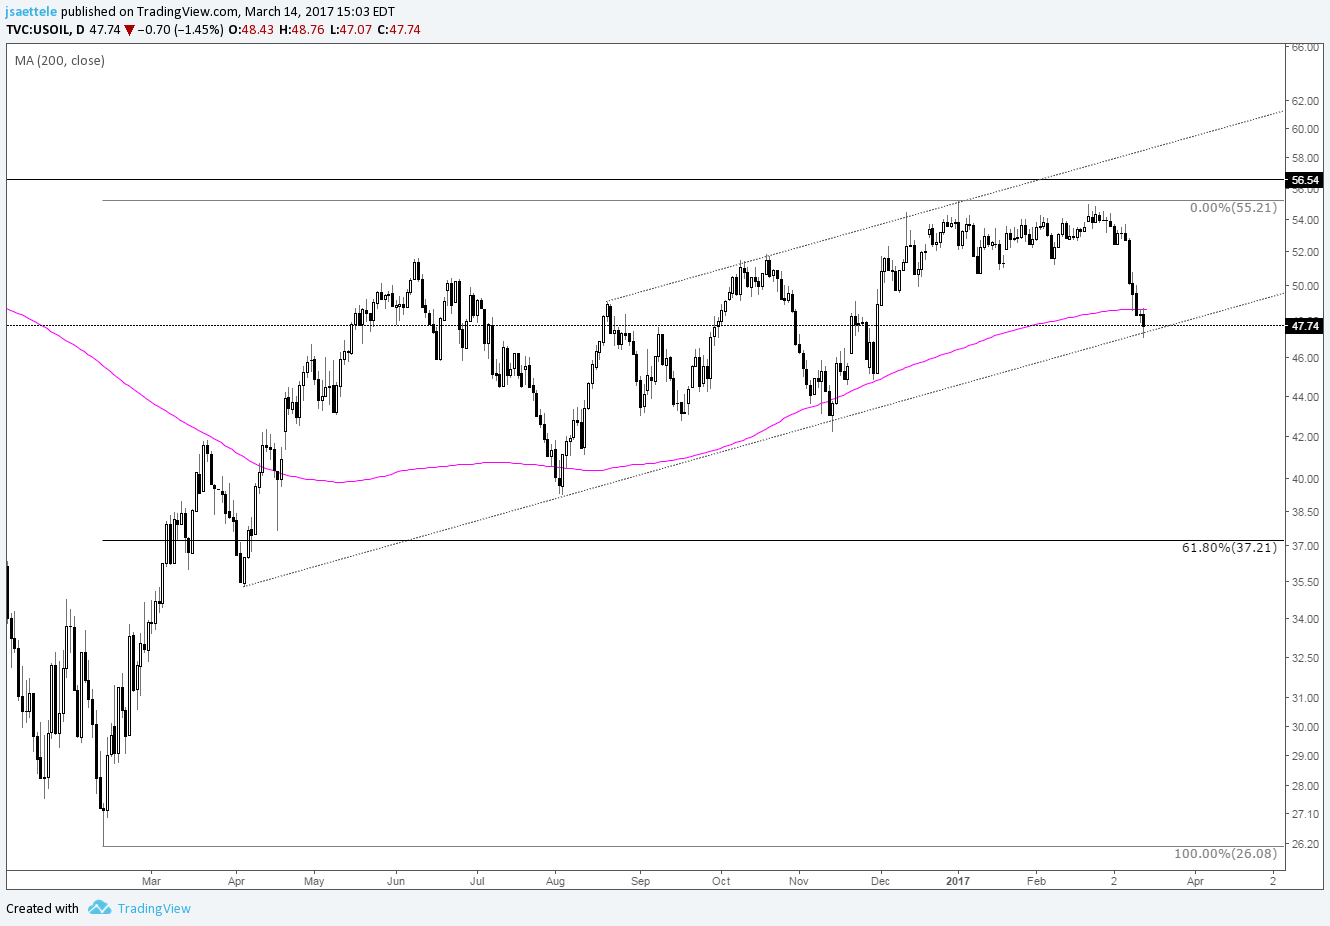
Chart Prepared by Jamie Saettele, CMT
DailyFX Trading Guides and Forecasts
-The last update remarked that “crude is crashing. The 200 day average is right here but the trendline is just above 47. If that doesn’t hold, then 37 (61.8% of rally from February 2016 and August 2015 low) is probably in the cards.” Low thus far is 47.07 so if crude isn’t going to spill then it needs to turn up now. A close back above the 200 day average would be a positive sign (a la what happened in August and November).


