


Access Free Oil Trading Guide from DailyFX Analysts HERE !
Talking Points:
- Crude Oil Technical Strategy: Move to 200-DMA (43.47) Important
- Anticipated Technical Washout to 200-DMA Now Watching Fundamentals & Cross-Market Moves
- Break Below 200-DMA would signal double-top that favors further downside
Are you ready for a big move in Oil? Ready or not, it appears we’re about to see one in addition to this week’s drop that has been the largest weekly decline since January when the CoT data showed us the Hedge Funds were starting to re-build long exposure. Whether you look at the upcoming geopolitical risk of the U.S. Presidential Election or the increasing implied volatility as we come to a key technical indicator, it appears we’re about to see a pivot or the start of a crash.
On Friday, we heard from OPEC Secretary General Mohammed Barkindo that Saudi, the largest OPEC producer, did not threaten to raise production if there was no deal on a cut. Barkindo has been busy trying to limit negative rumors swirling around about the unlikelihood of the deal to cut production before the formal negotiations on November 30 in Vienna.
Interested In a Quick Guide about OPEC, Click Here
The price of Oil has dropped just over 16% in 12 trading days. A further breakdown that would take us to a great than 20% loss would technically register a Bear Market. However, the most important development for technicians will be to see how the price reacts to the 200-DMA.
D1Crude Oil Price Chart: The 200-DMA Has Been Pivotal For USOIL
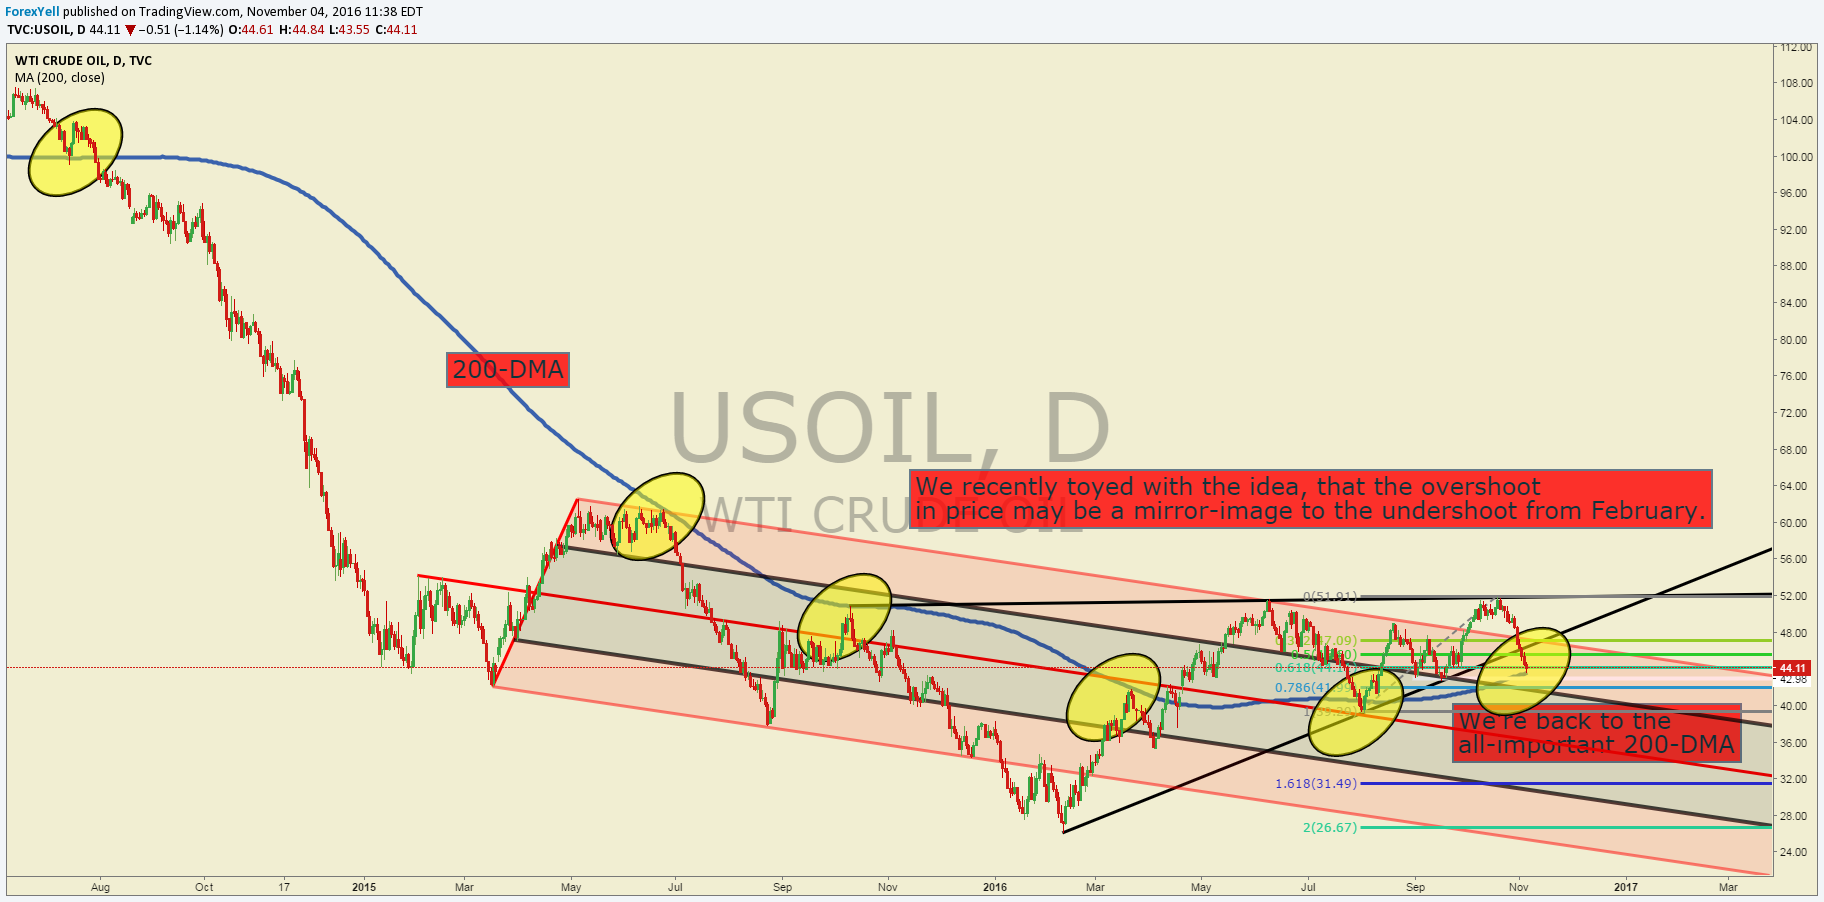
Chart Created by Tyler Yell, CMT Courtesy of TradingView
The chart above walks you through price reactions off the 200-DMA, which is visualized as a blue line. The move on Friday toward the 200-DMA was the lowest intraday move since October 20, and the first touch of the 200-DMA since early August.
Now, we’ll look to see if the price slices through the 200-DMA on a continued breakdown, which could bring up the discussion of a double top at $51/bbl. There is a similar time delay between the two tops at $51/bbl at 94 days as there was on the ~99% move from $26.03 to the $51.64 level on June 9 that took 85 trading days.
Additionally, we’ve seen what appears like a three-wave move higher that was initially anticipated to be a strong move higher could be a corrective move higher. If there has been a definitive corrective move higher, we will anticipate an impulsive decline, which could take us aggressively lower toward the August low of $39/bbl and possibly a good deal lower.
In our recent note, we shared the idea that a return to the median line of the bearish channel above may still be in play. A continuation of the retracement would take the price below the 200-DMA ($43.418/bbl) and toward the median line at ~$35/bbl. A corrective move higher and double-top that has a neckline of $39.23 would also target an aggressive Bear move.
One component that has not shown up as the price of Oil trades at the 200-DMA is a strong US Dollar. From an Intermarket-perspective, Dollar strength tends to align with Oil weakness like we say in H2 2014. While the recent bearish move in Oil has been on reliant on the breakdown in OPEC negotiations, a resumption of USD strength that we saw in late October.
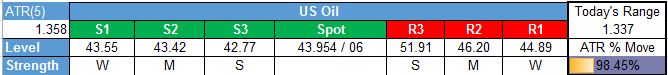
Key Levels Over the Next 48-hrs of Trading As of Friday, November 4, 2016
T.Y.
To receive Tyler’s analysis directly via email, please SIGN UP HERE


