


Access Free Oil Trading Guide from DailyFX Analysts HERE !
Talking Points:
- Crude Oil Technical Strategy: Following Move Higher With Support At Prior Triangle ($51-$49/bbl)
- Supply Balance & OPEC Seem To Align With Higher Prices Should Demand Rise
- Oil Price Closing in on Fourth Straight Weekly Gain, Gold Price Stable at $1,250/oz.
A favorite premise in technical trading of mine is that consolidation favors trend continuation. That truism played out in Crude Oil as we traded at 15-month highs on the back of a very large inventory draw per the EIA U.S. Inventory Data that showed U.S. Crude Inventories fell by 5.25mn bbl last week against expectations of a build of +2.1m bb. The equally active December contract (given that November closes on Thursday) is trading above $52/bbl. Cushing, OK Inventories also fell below 60m bbl for the first time this year on today’s report.
Interested In a Quick Guide about OPEC, Click Here
We have recently discussed the two-way positives for the Oil market of a near capitulation of bearish positions as per the CFTC Commitment of Trader’s Report and the 15-month low volatility readings we see in crude. Both factors have allowed little to stand in the way of Wednesday’s breakout.
In addition to the net-long positioning shift and low-volatility, we also see a weaker dollar emerge. While a weaker USD is expected to be temporary, and the relative valuations could keep USD supported it is still a boon for commodities in the short-run.
H4 Crude Oil Price Chart: Breakout > Triangle Consolidation Keeps Bulls Happy
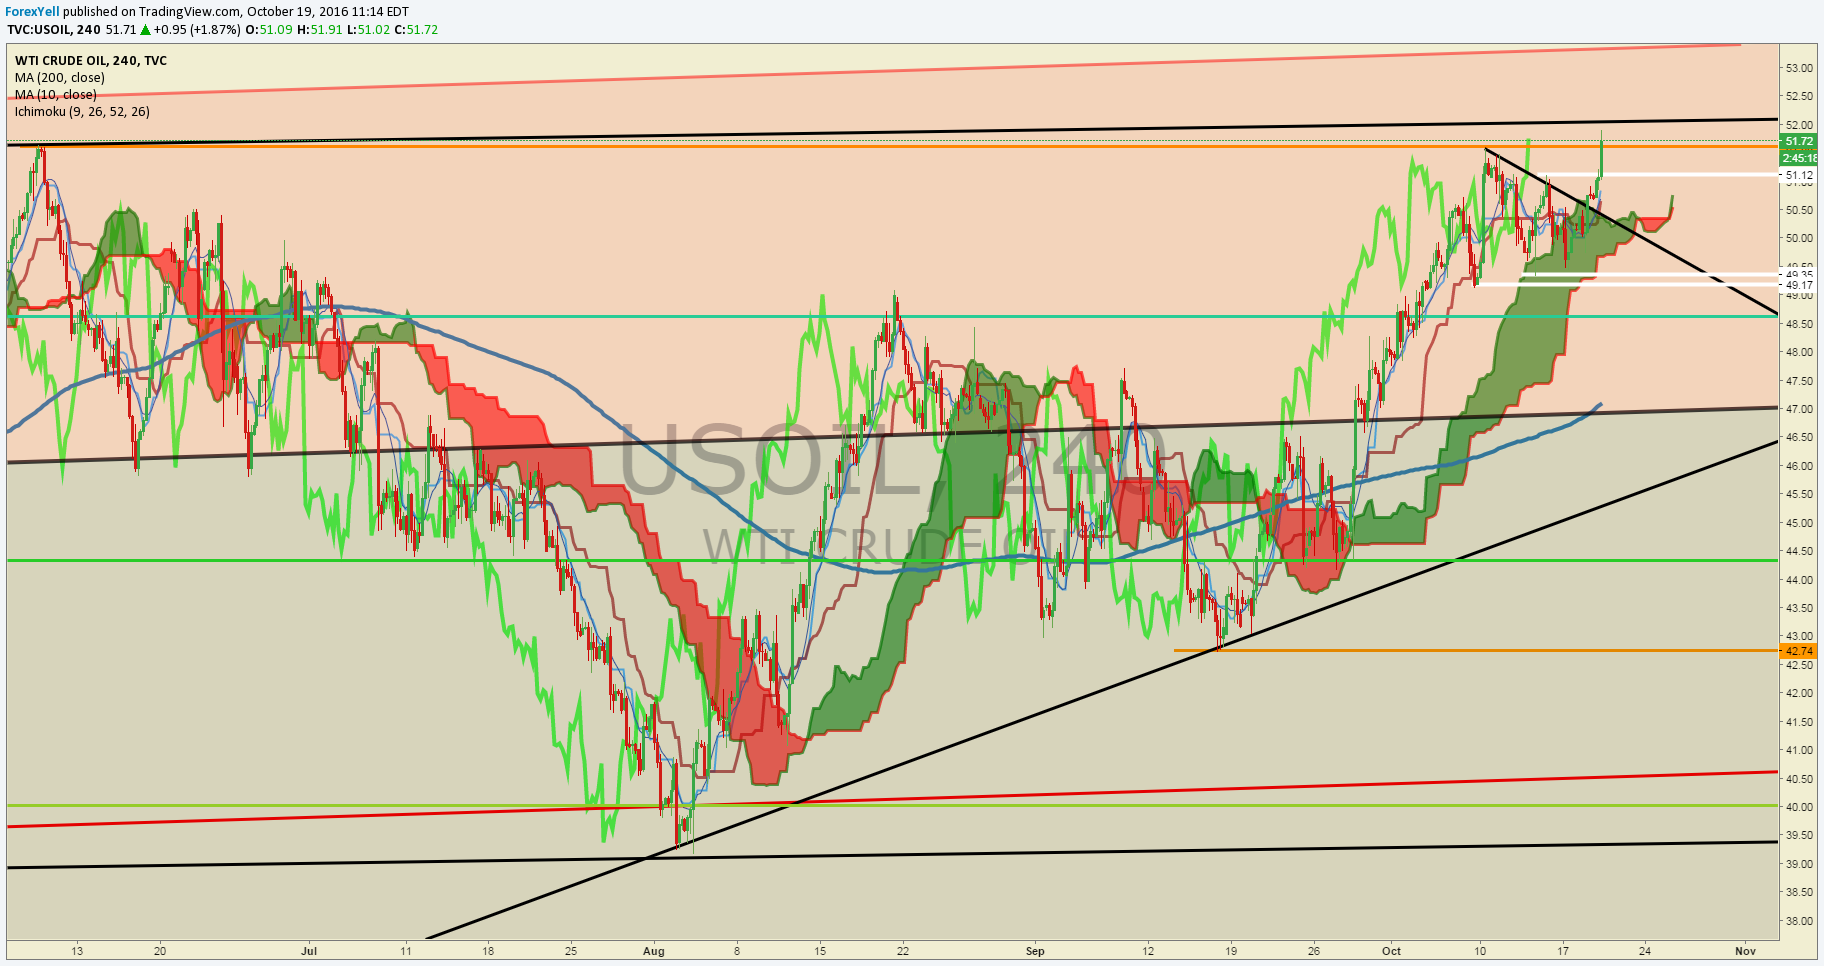
We have long been a proponent of a Bullish or Reverse head and shoulder pattern in Crude Oil that we discussed in our Q4 Oil Forecast. Wednesday’s price action brings us closer to that outcome. The Bullish pattern could take the once-battered commodity as high as $78/bbl.
The chart above shows the move above triangle resistance (upper white line) alongside above the June 9 high of $51.64/bbl. The Ichimoku Cloud on a 4-Hour chart can continue to act as a support in the move higher. A close examination will show you that the cloud is turning bullish once again whereas the mid-point is of the 9 & 26 trading-periods extended out 26-periods is moving above the 52-period mid-point. While Ichimoku has many components, the cloud turning is one of the leading indicators that the path of least resistance is now higher.
We’ll continue to favor a bullish continuation unless we get a break below the October 10th low ($49.35/bbl), which would turn us short-term neutral with the probability favoring a larger breakdown toward the 50-DMA near $46.50 before aligning with the longer-term bullish bias.
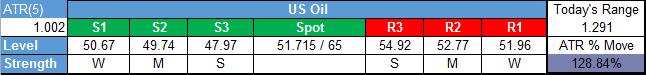
Key Levels Over the Next 48-hrs of Trading As of Wednesday, October 19, 2016
T.Y.
To receive Tyler’s analysis directly via email, please SIGN UP HERE


