


To receive Tyler’s analysis directly via email, please SIGN UP HERE
Talking Points:
- Crude Oil Technical Strategy: Environment Is Ripe For Retesting Resistance
- Dollar Drop This Month Providing Backdrop For Next Oil Rally
- Contrarian Sentiment System Now Favors Further Downside Risk
Oil volatility has fallen recently, but do not expect this quiet market to last. Later this month, the International Energy Forum in Algiers on September 26-28 will provide another highly anticipated opportunity for major Oil producers like Saudi Arabia, Iraq, & Iran to agree to stabilize oil prices by freezing output at current levels.
We recently heard from Iran’s Oil Minister, Bijan Namdar Zanganeh that ~$50-60/bbl Oil is best for OPEC, which could cut one of two ways. Brent Oil (CFD: UK Oil) has recently been trading around ~$50/bbl which could mean they could choose to forego the production increase freeze in hopes the market gets them to where the want to go while at the same time producing more. The more beneficial outcome naturally for Oil Bulls would be to go ahead with the Freeze to encourage the market to get closer to $60 so that the profit margin would be comfortable for the OPEC producers.
Access Our Free Q3 Oil Outlook As Oil's Best Quarter Looks For Confirmation
Lastly, over the weekend, we heard news of a potential Russia-Saudi Oil pact that seemed to dissipate as the market opened on views that they were both interested more in higher prices without the production cut. That would tend toward the first, albeit less influential outcome mentioned above.
Track short-term Crude Oil price levels and patterns with the GSI indicator!
The OPEC Chief, Barkindo has said that he is, “Optimistic about the success of [Algiers].” Of course, there remain many skeptics since this accord is in all-or-nothing fashion so a key player failing to agree would unravel the hope of lower production instead of higher (hopefully) Oil prices.
D1 Crude Oil Price Chart: Pressure On Bearish Channel (Red) Likely To Return
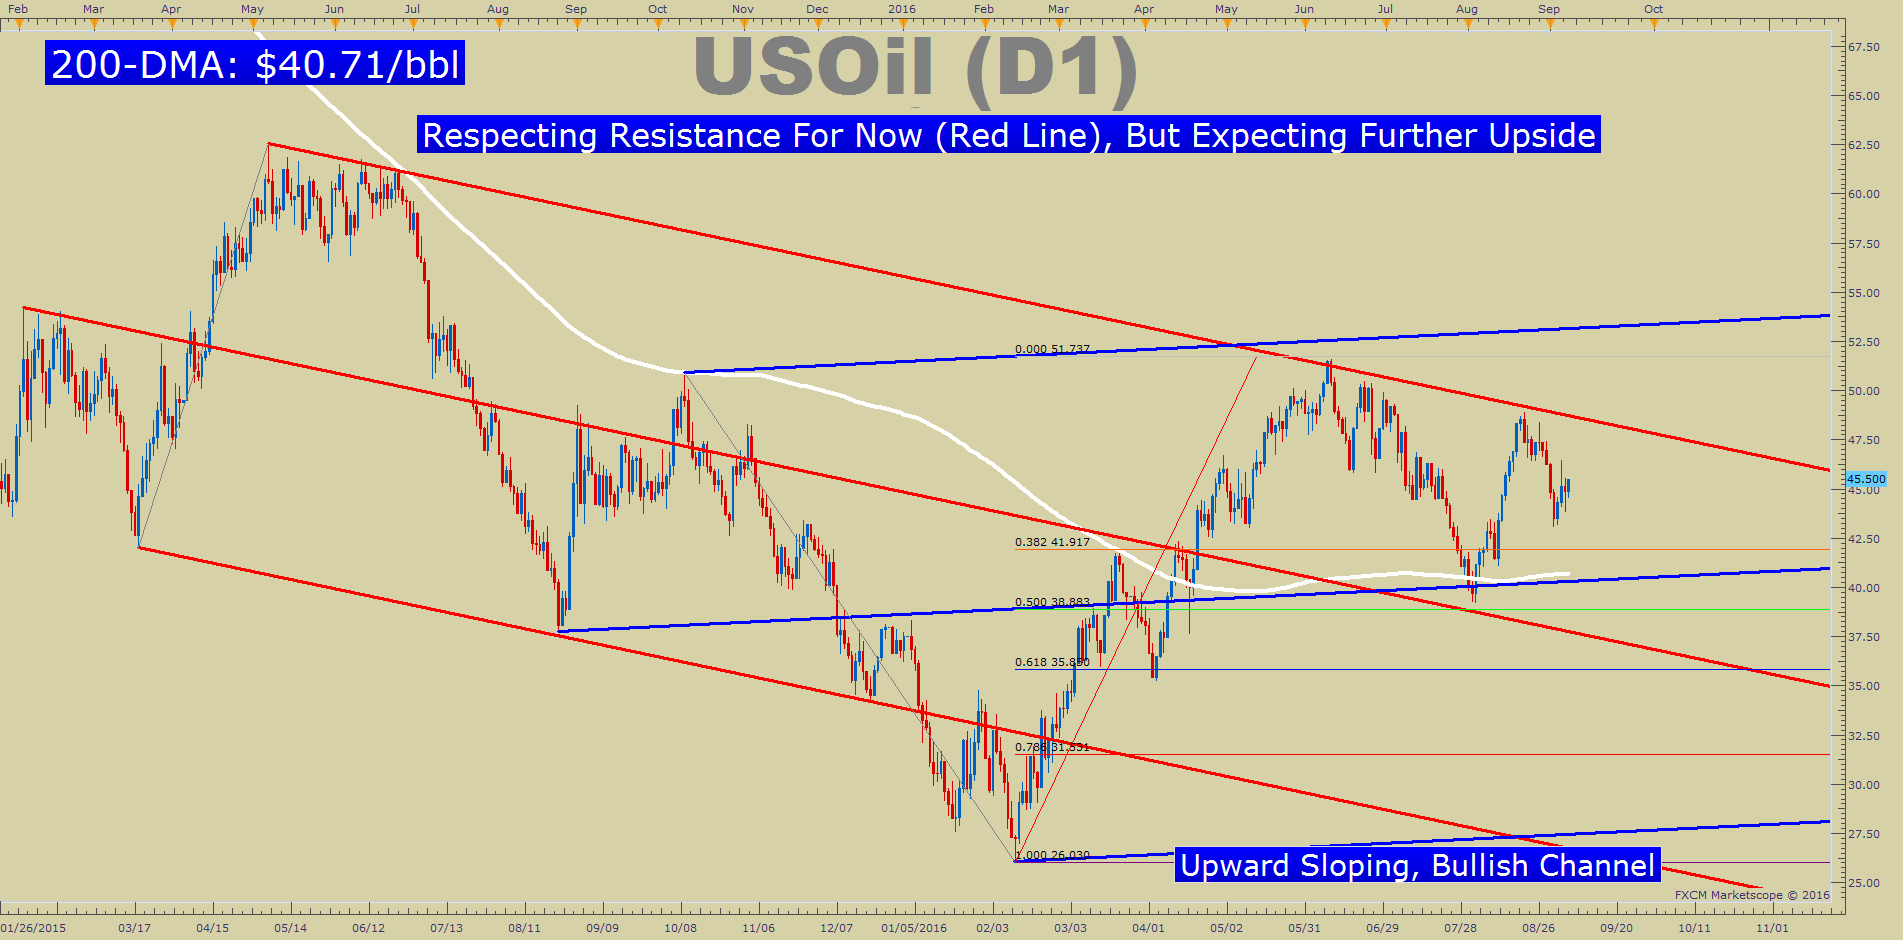
The chart above shows the price action in US Oil over the summer. For now, the price looks to be ranging from support of ~$40/bbl and resistance of ~$50/bbl. The recent fluctuation around $45 may be helpful for the stability of the market, and may make a move higher strong if it can break through long-term trend resistance that currently sits near ~$49/bbl.
Given the significance of the downtrend from summer 2015, it’s important that we give more credence to continuation over a reversal. However, it would equally be unwise to discount too heavily the developing bullish arguments for Oil.
The weaker US Dollar is a key player, and seasonal tendencies show that trend could continue for the month of September. Above, the 200-DMA has been added to the chart to help you maintain an appropriate bias. The 200-DMA has long been a clear technical bias divider in Oil, and if that remains the case, then the bias is now higher.
You’ll note the 200-DMA ($40.71/bbl) aligns with the median line of the Bullish Pitchfork (Blue) and the early August low. If the price can hold above there, while positive developments build, we’ll continue to await patiently the next breakout higher. A break below this zone will turn us from Bullish to Neutral.
Contrarian System Now Favors Downside Risk as of 9/7/16
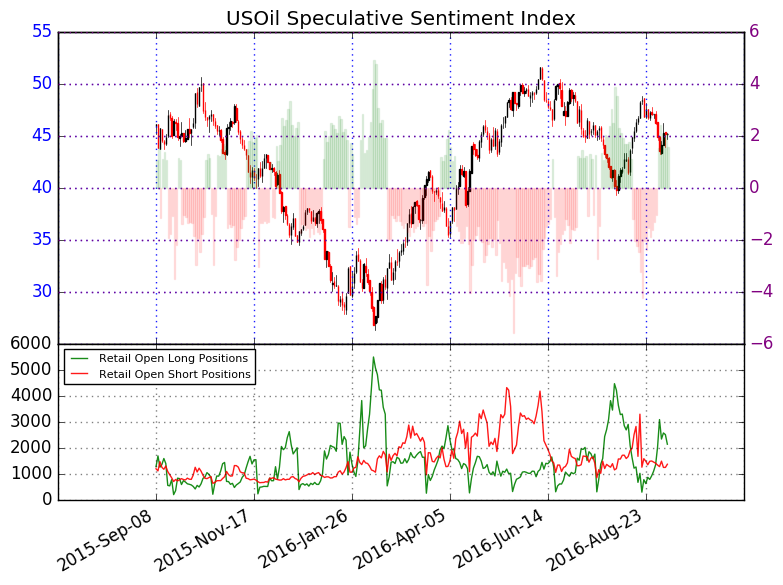
In addition to the technical focus, we should keep an eye on retail sentiment as the downside is beginning to align with our Speculative Sentiment Index or SSI for now.
As of midday-Wednesday, the ratio of long to short positions in the USOil stands at 1.61, as 62% of traders are long. Yesterday the ratio was 1.75; 64% of open positions were long. Long positions are 20.6% lower than yesterday and 8.0% above levels seen last week. Short positions are 14.0% lower than yesterday and 4.9% below levels seen last week. Open interest is 18.2% lower than yesterday and 0.4% above its monthly average.
We use our SSI as a contrarian indicator to price action, and the fact that the majority of traders are long gives a signal that the USOil may continue lower. The trading crowd has grown less net-long from yesterday but further long since last week. The combination of current sentiment and recent changes gives a further mixed trading bias.
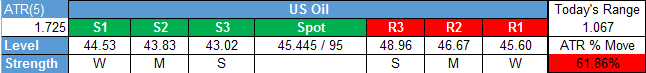
Key Levels Over the Next 48-hrs of Trading As of Wednesday, September 7, 2016
T.Y.
Think Oil has more room to run? Trade Oil With Low Margin Requirements (non-US Residents only)


