


To receive Tyler’s analysis directly via email, please SIGN UP HERE
Talking Points:
- Crude Oil Technical Strategy: Oil Sitting At Structural Support, Break Could Bring Further Drop
- Dollar Drop on Thursday morning was not enough to stall Oil Breakdown
- Contrarian Sentiment System Now Favors Further Downside Risk
Access Our Free Q3 Oil Outlook As Oil's Best Quarter Looks For Confirmation
Was it something Russia said? Thursday morning’s breakdown seemed to carry through after the DoE data that showed a US aggregate Inventory rose 2.28 million. We did see another rise of Baker Hughes Rig Count, although the increase is rather slow. However, Russia seemed to pour cold water on hope for a production Freeze when they noted that a freeze is not necessary with prices near $50. Given the events this week, $50/bbl may be pulling away from current price unless action on the supply side is taken.
However, the quick drop in the price of Oil that we’ve seen this week seems to be an indication of how fragile the Oil market remains. A further breakdown may help turn focus to the longer-term benefit of capping production. Unfortunately, when these production caps become priced in but do not lead to an actual cut, the market seems to capitulate positions held in hope.
Track short-term Crude Oil price levels and patterns with the GSI indicator!
In August, the price of WTI Crude Oil rose by ~8% on speculation of an OPEC production freeze at the September Algiers meeting. An output cut is not expected, but a production freeze could be enough to re-stimulate the market if the implied demand numbers continue to rise.
If we do see the breakdown continue in the price of Oil that takes us below $40, we may see a change of tone from hesitant countries to the production freeze.
H4 Crude Oil Price Chart Bearish Break Through Price Channel, Awaiting Strength Later

The chart above shows the price action in US Oil over the summer. For now, the price looks to be ranging from support of ~$40/bbl and resistance of ~$50/bbl. The price also broke lower through a corrective price channel since peaking on August 21. A break above corrective resistance at $48.43 would be enough to encourage technically based traders to rejoin the Bull trend.
Looking at the internal structure of the August move, the August 9 high of $49.49/bbl should hold as support if the uptrend is to continue. If $49.49/bbl does not hold, we could well be on our way toward a break back into the very painful $30/bbl range. Very painful for Oil Bulls, including producers around the world.
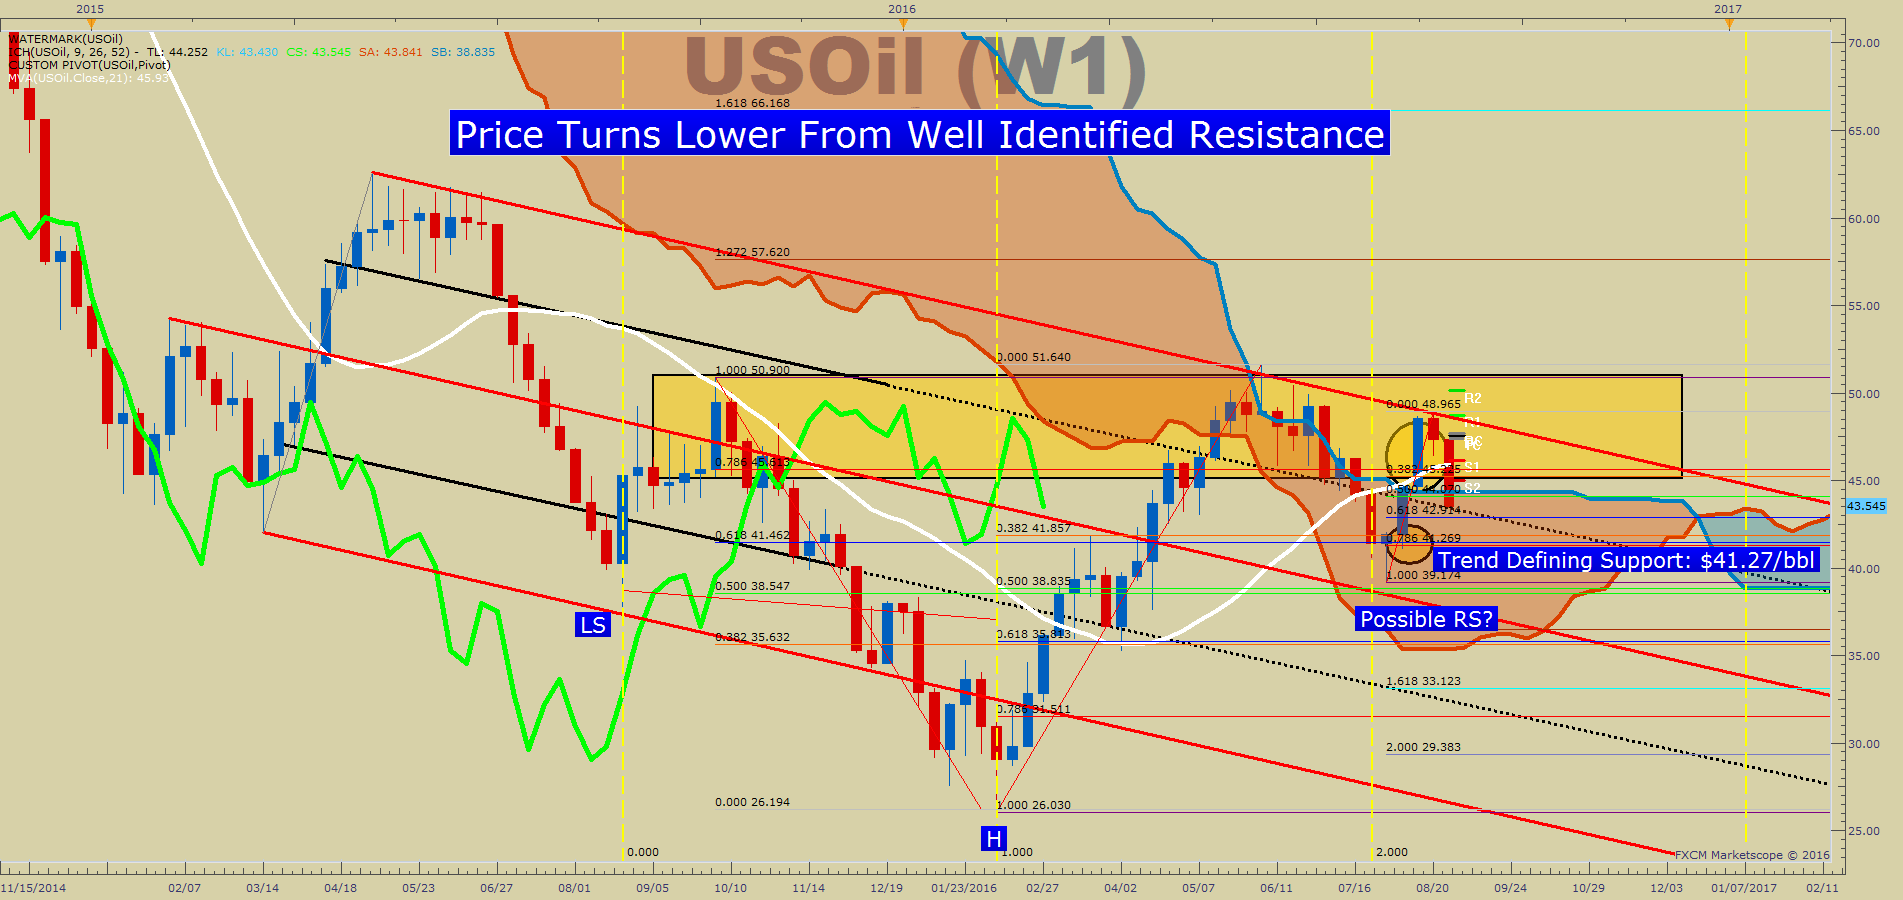
Over the last few notes, we have discussed how the longer-term/ weekly chart (above) shows a framework for a Bullish Head & Shoulder’s Pattern. A legitimate breakout would be validated on a break of the price of Crude Oil above $51.64/bbl. If the price broke out and sustained above the highlighted range near ~$50/bbl, we would favor a move to $66.16, which would be 61.8% extension of the Head & Shoulder’s range and $75.60/bbl, a 100% extension, and traditional Head & Shoulder’s target.
However, there are a lot of headwinds. As of this week, the stronger US Dollar will likely provide better prices to buy (read: likely heading lower) with a support zone in focus now on $43.50/bbl. Only a move below there and a stronger US Dollar would put our medium term Bullishness on the shelf.
The key support that would deflate the confidence of the 20%+ August trend would be a break below the higher low of $41.08/bbl from August 11. A breakdown below there could be the first confident sign that price will continue to wallow lower in the falling channel drawn on the chart.
Bottom Line:
The market still seems favorable long-term for the price of US Oil. US production may continue to fall, and if an OPEC accord limits new production growth, the fundamentals may be setting up for further price appreciation.
On the technical side, we need to see a price break above the bearish channel on the long-term chart, which currently aligns with the ~$49/bbl price. A break above the YTD high of $51.64, would naturally usher in new hope about another great run in Oil similar to that of Q2 2016.
Contrarian System Now Favors Further Downside Risk as of 9/1/16
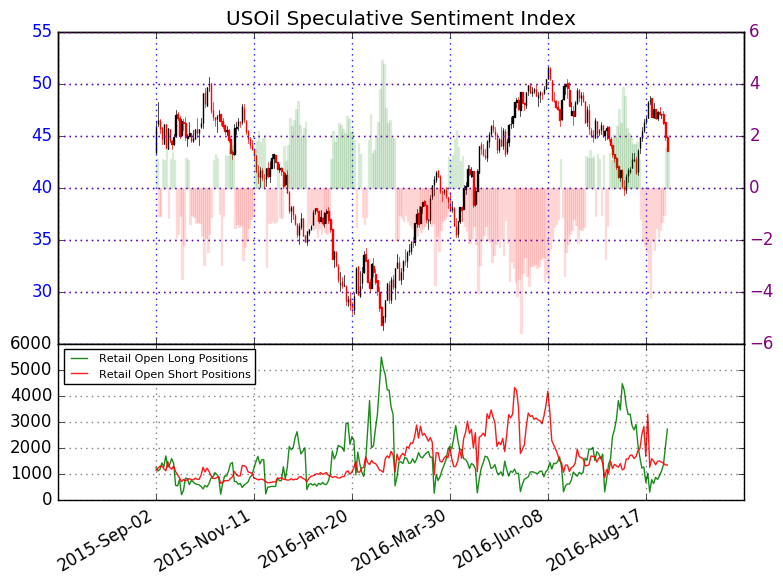
In addition to the technical focus, we should keep an eye on retail sentiment. The upside is beginning to align with our Speculative Sentiment Index or SSI for now.
As of midday, Thursday, the ratio of long to short positions in the USOil stands at 2.03, as 67% of traders are long. Yesterday the ratio was 1.42; 59% of open positions were long. Long positions are 38.2% higher than yesterday and 223.5% above levels seen last week. Short positions are 3.6% lower than yesterday and 5.9% below levels seen last week. Open interest is 21.0% higher than yesterday and 11.5% above its monthly average.
We use our SSI as a contrarian indicator to price action, and the fact that the majority of traders are long gives signal that the USOil may continue lower. The trading crowd has grown further net-long from yesterday but unchanged since last week. The combination of current sentiment and recent changes gives a further bearish trading bias.
Key Levels Over the Next 48-hrs of Trading As of Thursday, September 1, 2016

T.Y.
Think Oil has more room to run? Trade Oil With Low Margin Requirements (non-US Residents only)


