


To receive Tyler’s analysis directly via email, please SIGN UP HERE
Talking Points:
- Crude Oil Technical Strategy: Favoring Downside < $45/bbl
- Intermarket Analysis Shows US Dollar May Be Public Enemy #1 For Crude Bulls
- Sentimental Trading System Shows The Trend May Be Reversing
The price of WTI Crude Oil (CFD: USOil) traded at its lowest levels in 42 trading days or since May 11. The shortened week showed dual risks building up as inventory showed less demand than anticipated. The weak DOE data on Thursday was followed by a strong Non-Farm Payroll that may act as a boost for the US Dollar.
This week’s inventory data continued the trend over the last 6-weeks of draws on the stock of U.S. Crude Oil Inventory. We simply had a smaller draw than expected which was enough to send WTI Crude Oil below previously identified support of ~$45/bbl.
Another building fundamental story to keep an eye on before we get to the charts is the increase in exports from Russia. An encouraging story has been the balancing out of the supply glut even as the price of Oil. However, Russia may be the new OPEC in terms of threatening the recovery. Since July 2014, Russia’s shipments have increased, and their YoY shipments have increased 4.9%.
That being said, we could be seeing a new wave of supply coming onto the market, and if Demand cannot keep up, we could move lower. To explain how much lower, let’s move on to the charts.
As US Dollar Has Support, Watch Polarity Level on USOil At ~$45/bbl
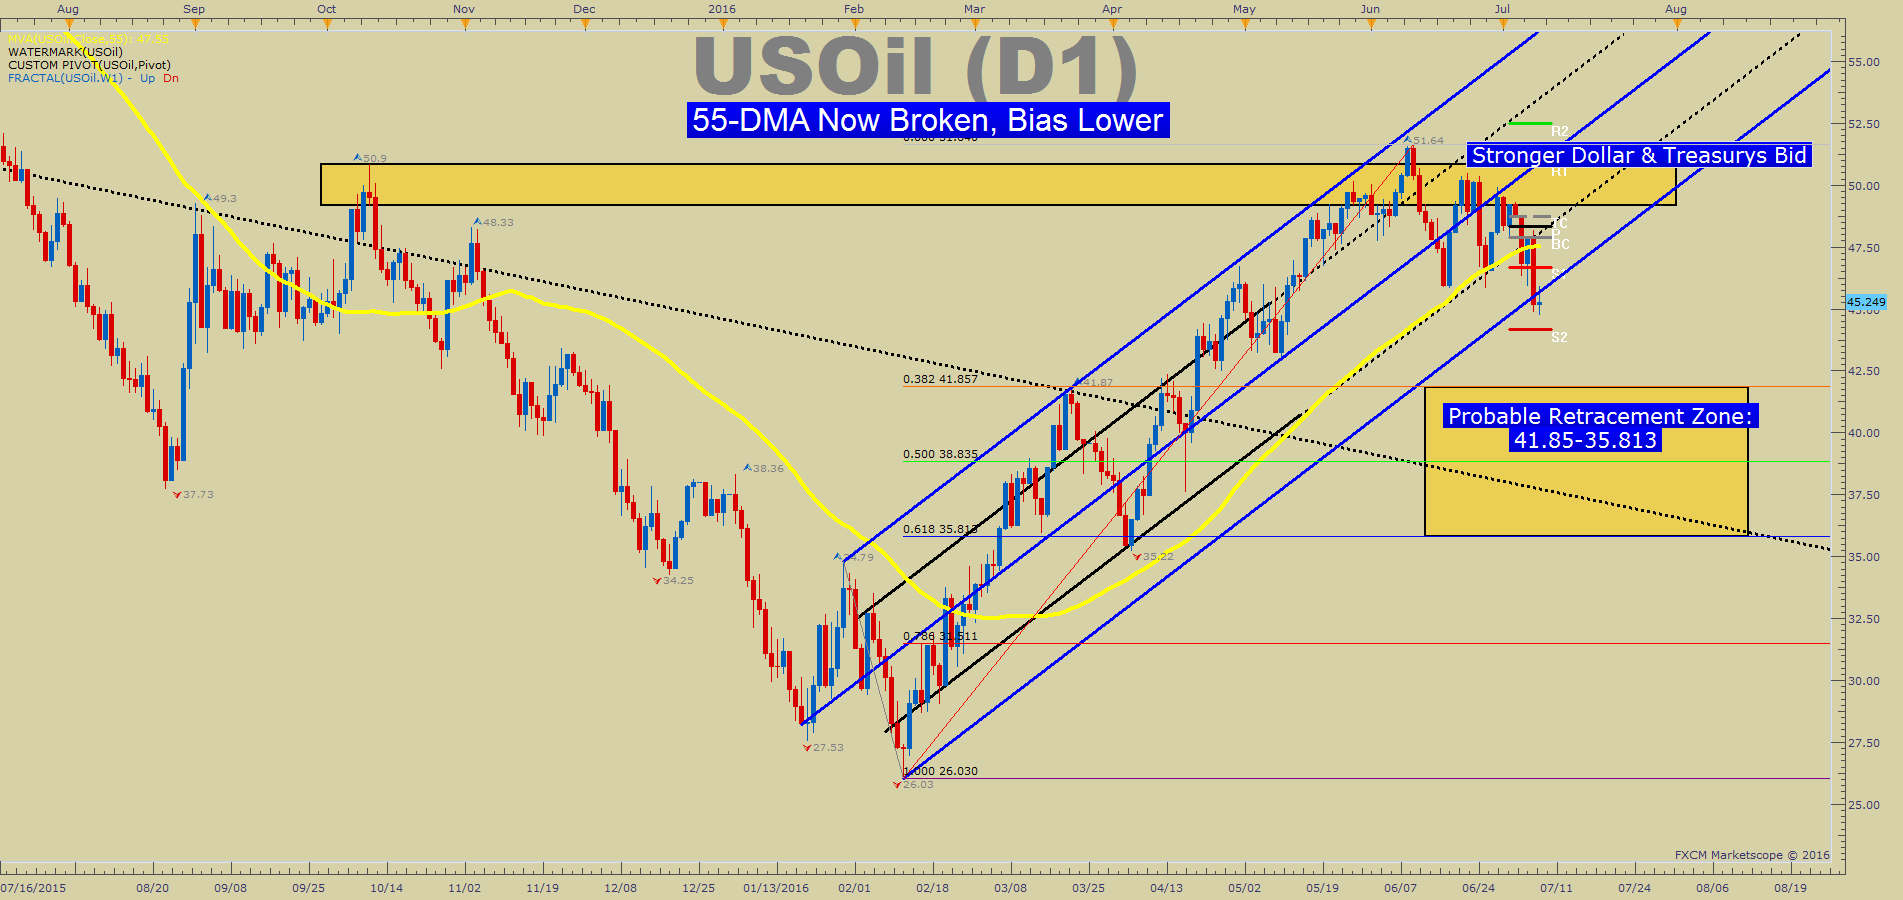
We’ve long been a fan of the 55-Day Moving Average as a rudder on medium term Crude Oil sentiment. Currently, Oil is trading below the 55-DMA at $47.54/bbl. The Fibonacci-Sequence Based Moving Average has held as safe support for nearly four months now. This week’s break could prove significant, and now we will use the 55-DMA as resistance as we brace for a move lower.
As of Friday, the price of USOil is approaching the Weekly S2 Pivot at $44.17/bbl. If we break below this point of support, we will likely be aiming towards the first significant Fibonacci Support of the February to June range.
A break below the $45/bbl level, which has acted as recent support, would open up the scenario of further weakness toward the 38.2%-61.8% retracement zone of the February-June rally. This zone is around $41.85-$35.81/bbl. US Dollar strength would hasten such a move.
In addition to the 55-DMA acting as resistance, if we’re able to break above this level we’d be quick to focus on the current June high of $51.64/bbl. There is a lot of resistance in the $51/bbl region such as the 100% Fibonacci extension move off the February low and the October 2015 higher.
Therefore, the pullback we’ve seen is not surprising. Furthermore, if we break above the ~$51 resistance level, a stronger break toward the next key resistance level ~$60 could be underway.
Contrarian System Warns of Further Downside As of 7/8/16
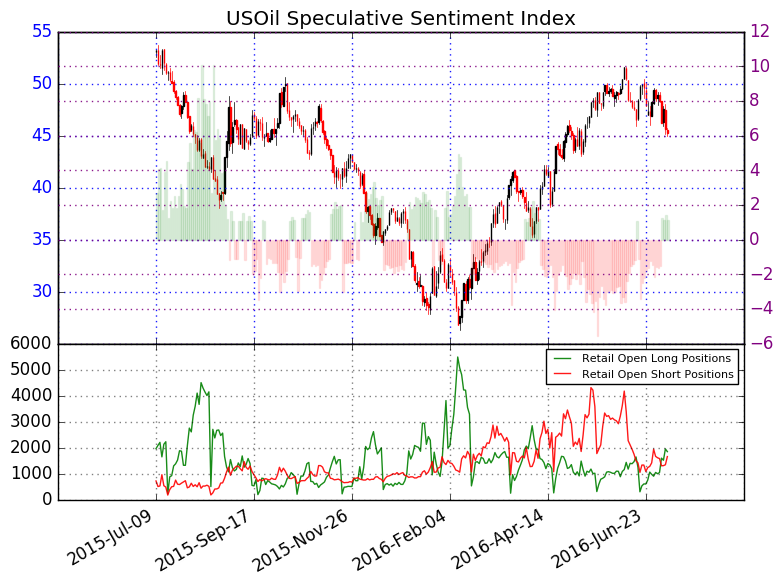
In addition to the technical focus around multiple support-zones, we should keep an eye on retail sentiment, which favors more downside price action. Further downside is currently aligned with our Speculative Sentiment Index or SSI for now.
As of mid-day Friday, the ratio of long to short positions in the USOil stands at 1.12, as 53% of traders are long. Long positions are 4.4% lower than yesterday and 57.5% above levels seen last week. Short positions are 28.6% higher than yesterday and 1.6% above levels seen last week.
Open interest is 8.7% higher than yesterday and 22.7% above its monthly average. We use our SSI as a contrarian indicator to price action, and the fact that the majority of traders are long gives a signal that the USOil may continue lower. The trading crowd has grown less net-long from yesterday but unchanged since last week. The combination of current sentiment and recent changes gives a further mixed trading bias.
Key Levels Over the Next 48-hrs of Trading As of Friday, July 8, 2016

T.Y.


