


USD/JPY Technical Highlights:
- USD/JPY is carving out a rising wedge pattern at 20-yr highs
- Downside break could lead to quick losses
- An upside breakout is seen as being potentially terminal
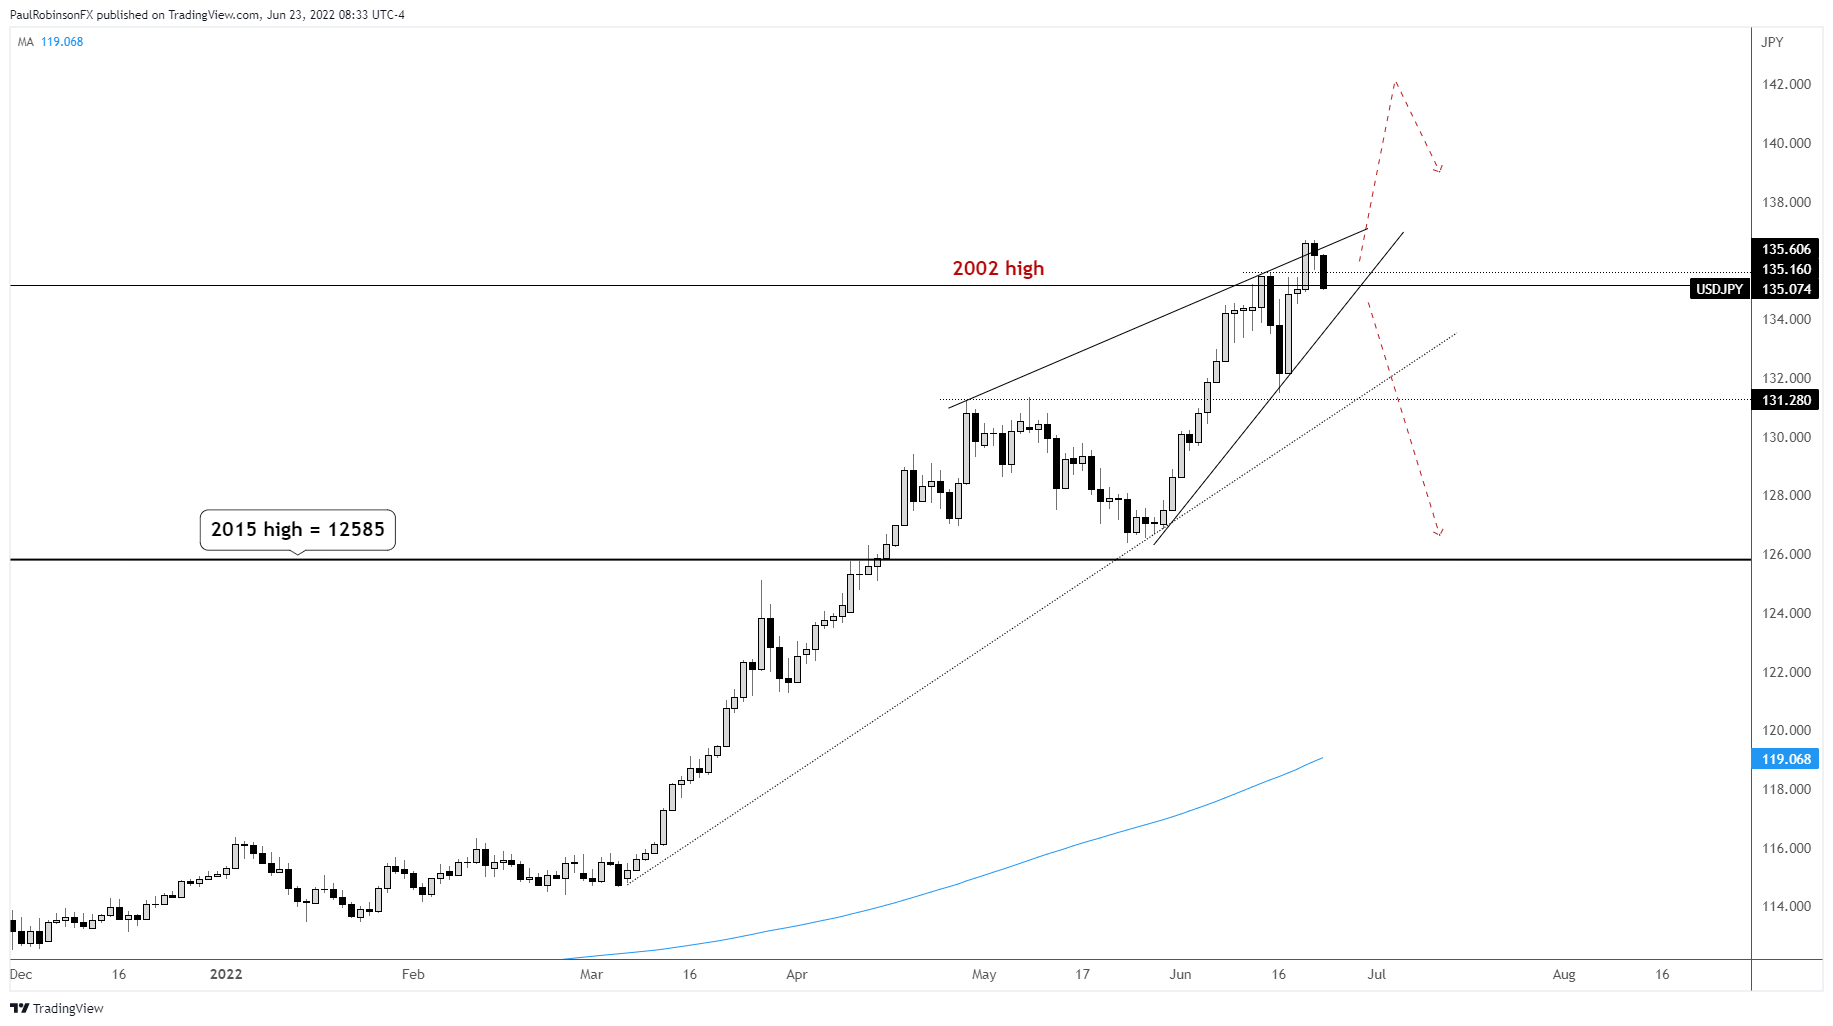
USD/JPY price action is contracting as it runs higher and this is leading a rising wedge formation. We aren’t quite there yet with its maturity, but will be soon. This is also developing around two decade-old resistance in the 135s, which makes it even more interesting.
The nature of these patterns is that they often times lead to reversal of trend for at least a strong corrective period, but that isn’t always the case. The patterns can lead to sharp breakouts in-line with the trend, but these often prove to be a final ‘hurrah’ before reversing.
Either way the pattern is viewed through the lens of arriving near the beginning of the end of the trend. Again, at least for a period of time while the market digests the long run prior to the forming of the rising wedge.
First, looking at the bearish scenario. A breakdown out of the pattern by taking out the underside trend-line often times leads to a sharp decline as the market is caught leaning the wrong way. The combination of an extended trend and contracting volatility can be an explosive one. If this were to play out then look for USD/JPY to fall as far as the bottom of the pattern in the 126s in fairly short order.
On the flip-side, if we see USD/JPY squeeze out of the top of the pattern then a burst higher could develop, but is likely to be short-lived as the market quickly runs out of gas. Again, the combination of an extended trend and wedging price action often leads to an explosive outcome. In this case, the move higher is likely to be transient even if it is powerful.
You can’t rule out a fake-out breakout to kick off the move, that is a swing in one direction that is quickly reversed and takes out the other side of the pattern. These are typically easier to play if the top-side is the head-fake since the market is already quite long and provides plenty of fuel (sellers).
I would estimate we are within a week of seeing which way this wants to unfold. Running with the initial breakout, but if we see that breakout turn out to be false then flipping the bias with the momentum.
USD/JPY Daily Chart
Resources for Forex Traders
Whether you are a new or experienced trader, we have several resources available to help you; indicator for tracking trader sentiment, quarterly trading forecasts, analytical and educational webinars held daily, trading guides to help you improve trading performance, and one specifically for those who are new to forex.
---Written by Paul Robinson, Market Analyst
You can follow Paul on Twitter at @PaulRobinsonFX


