


USD/JPY Technical Highlights:
- USD/JPY head-and-shoulders pattern forming
- Short-term ascending wedge triggered
For over two months USD/JPY has struggled to rally above a major area of resistance extending back to May 2017. The area around 11450 has been a very difficult one with only daily closes developing above it, but always failing on the weekly chart to sustain.
Given the duration of the level (4.5 years and counting), a weekly close is needed to prove that resistance has been truly broken. The rejection on the week of November 22 firmly cemented the importance of resistance, and also formed the head of a would-be head-and-shoulders formation.
The left developed during October into November, the head in November, and now the right shoulder could be in the process of developing. In the instance of almost all head-and-shoulders it is best to wait for the neckline to break, as this is the true confirmation with these patterns.
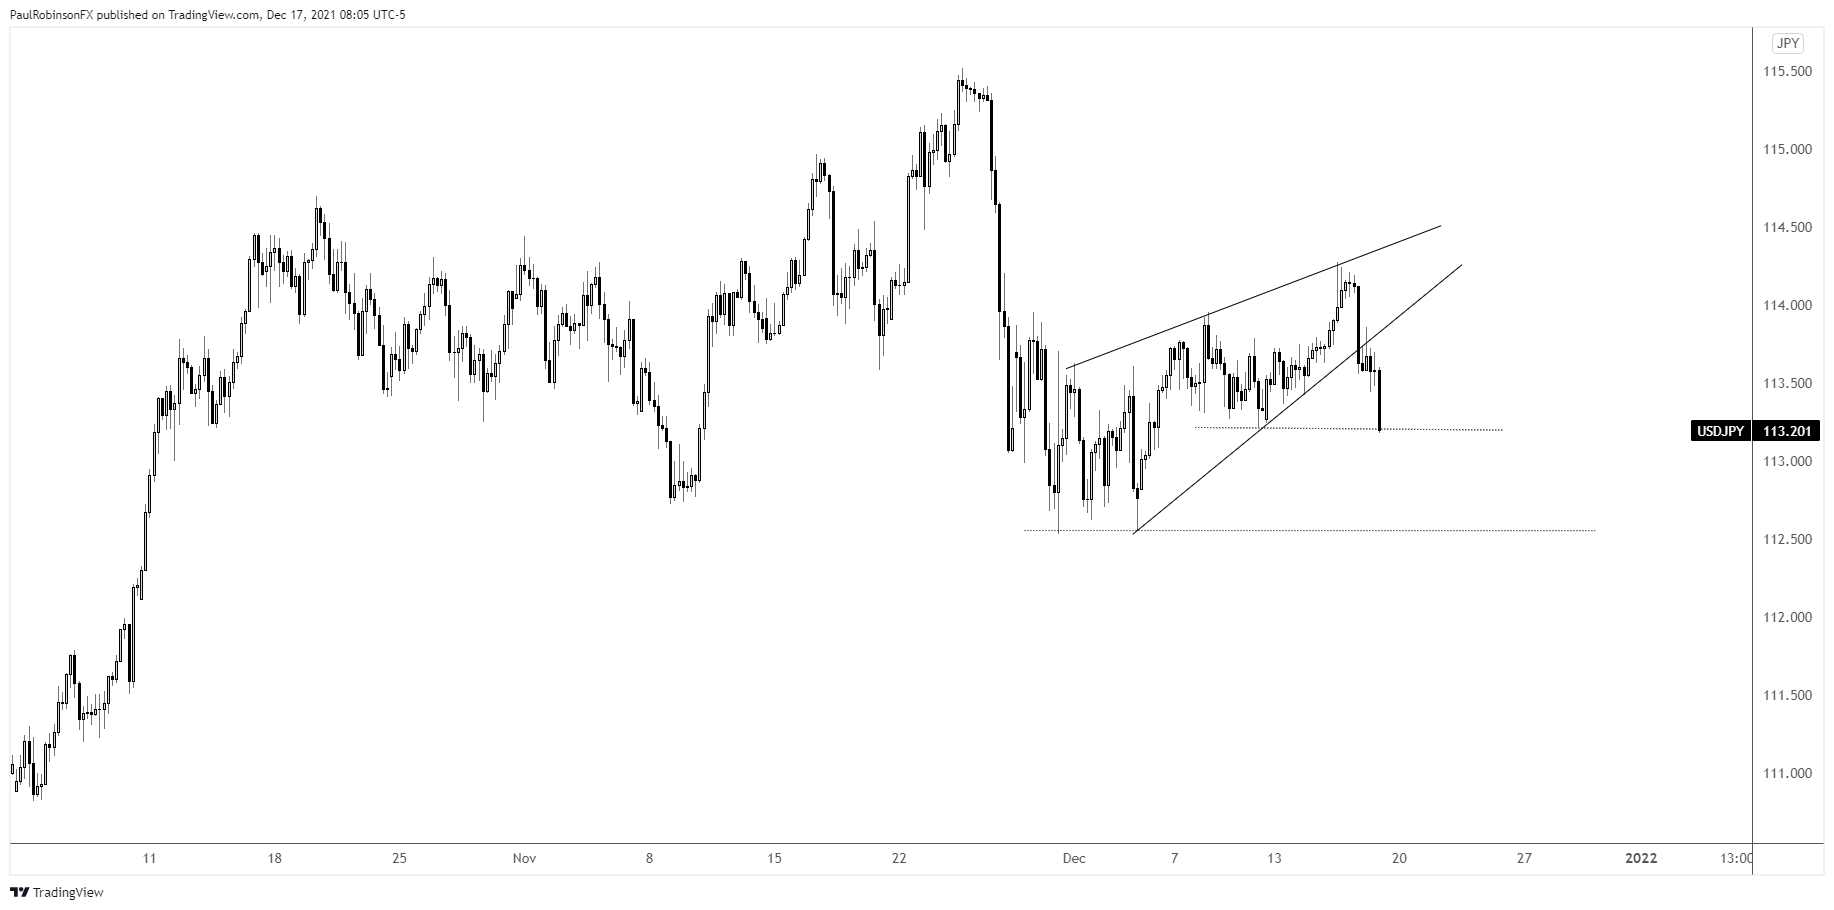
And while that is true in this case as well, there is another set up that can give traders a lead on the pattern. The right shoulder took the shape of an ascending wedge and triggered as of yesterday, best seen on the 4-hr chart. Wedge entries could morph into a larger trade.
The target for the wedge is the neckline of the formation, with the most recent swing-low at 11253 as the first meaningful level of support. There is a minor near-term level at 113.22, but not seen as anything but a potential bump in the road.
A decline to the neckline will also bring into play some major peaks from 2019 and 2020 as well as a trend-line from January of this year. The area surrounding 11200 is a big one, so we will want to pay close attention to price action to determine our next move.
It very well could end the decline off the November high and mark the end of a corrective period within the context of the uptrend since January. This is why this head-and-shoulders pattern may not actually come to fruition, but if it does it could lead to a big downdraft as major support breaks. And if it holds in convincing fashion it could offer would-be longs a solid risk/reward opportunity to join the broader trend higher.
I’ll discuss the broader scenarios at a later time should we get down to the neckline. For now, staying the course with a near-term bearish bias based on the breaking of the wedge.

USD/JPY Daily Chart

USD/JPY 4-hr Chart
Resources for Forex Traders
Whether you are a new or experienced trader, we have several resources available to help you; indicator for tracking trader sentiment, quarterly trading forecasts, analytical and educational webinars held daily, trading guides to help you improve trading performance, and one specifically for those who are new to forex.
---Written by Paul Robinson, Market Analyst
You can follow Paul on Twitter at @PaulRobinsonFX


