


USD/JPY Technical Outlook
- USD/JPY coiling up after big leg up
- Looks most likely to rally
- Needs to break big resistance

USD/JPY Technical Analysis: Gearing Up to Move (Likely Higher)
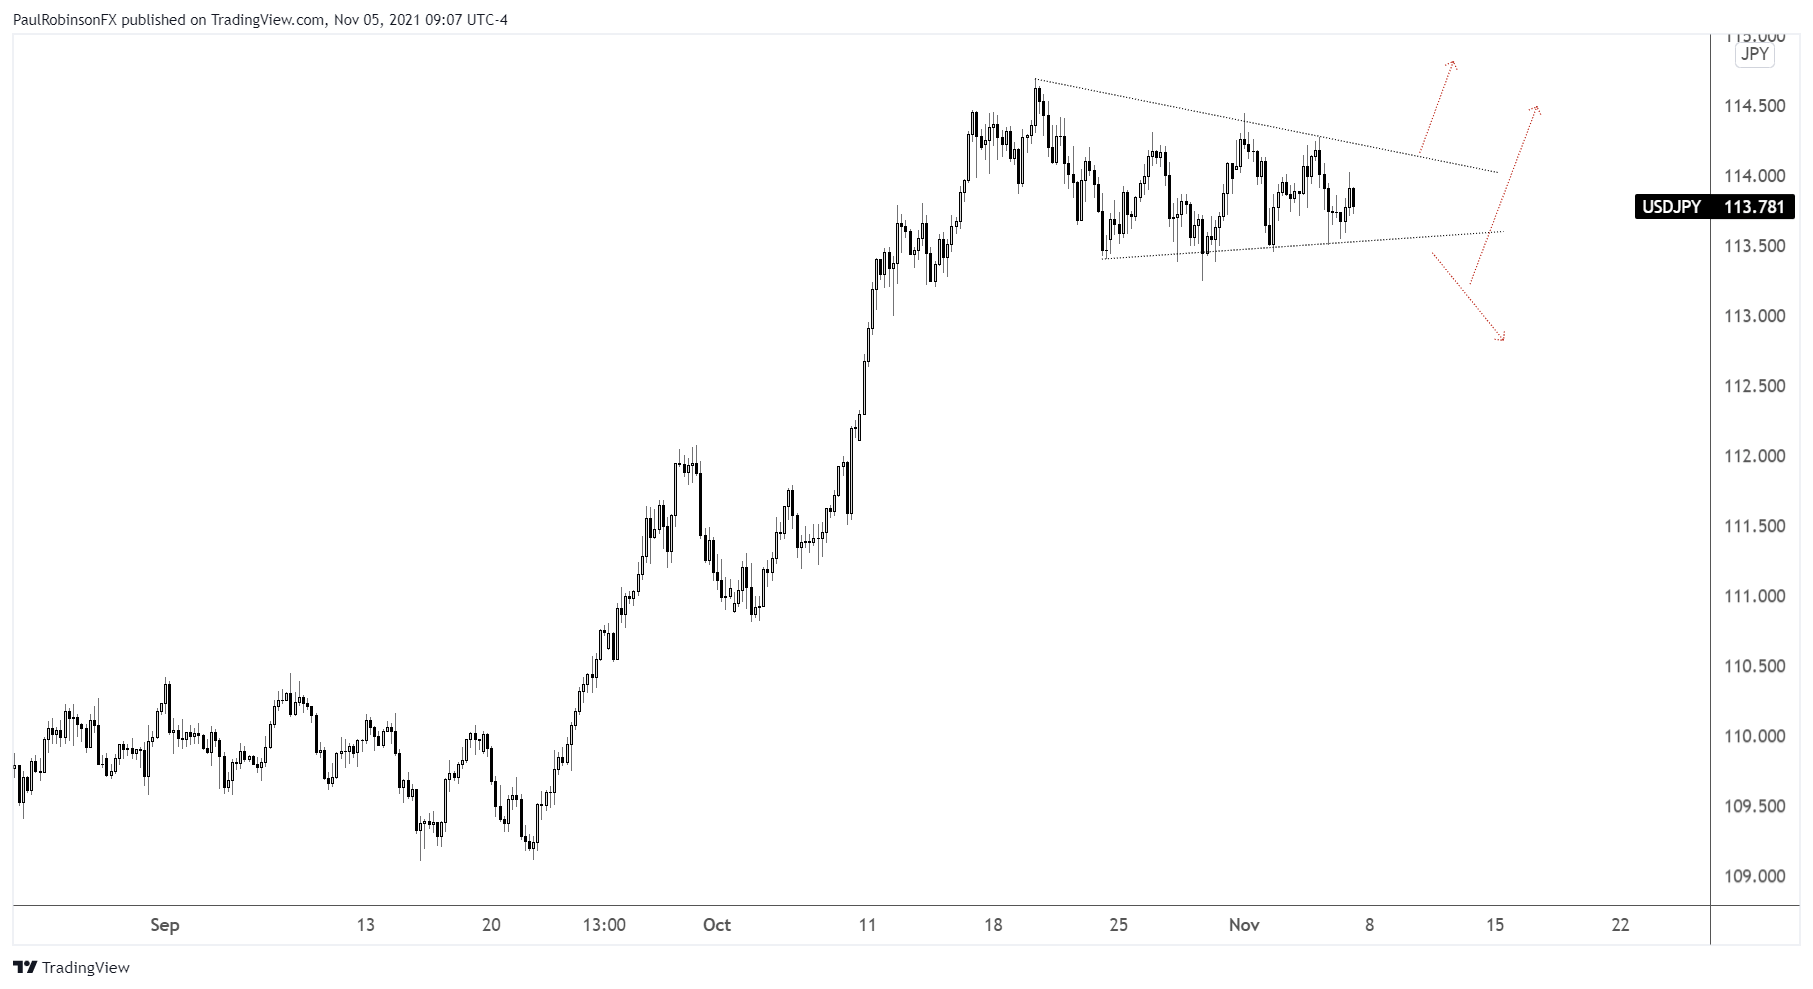
Last month, USD/JPY took its first leg up since breaking out a multi-year wedge earlier in the year. The October rally was quite the surge, and with the last three weeks seeing price move sideways, USD/JPY has put in a base that is seen as leading to further strength.
The base has taken on the shape of a wedge pattern. These can be one of the best types of continuation-style patterns as the compression in volatility gets released. Looking at the symmetry of the pattern, it could take a few more days, but it appears that by the end of next week we should see a move.
The wedge is forming at an interesting spot on the long-term chart. There are several peaks from 2017 to 2019 that formed between 11400 and 11500. The highest point was in November 2017 at 11473, just 4 pips higher than the October high at 11469.
If the wedge triggers and resistance is taken out, then we could see another extended leg higher. Looking to the left on the weekly chart there isn’t any highly meaningful resistance to be found until the December 2016 high at 11866.
Now, it is possible that USD/JPY breaks lower out of the wedge. A decline out of the wedge and break below 11325 could have price rolling lower. But we will want to be on the alert for a fake-out. Wedges can have a false move first before ultimately triggering in the opposite direction. Wedges forming within the context of a strong trend this tends to be even more common.
Tactically speaking, playing the break as it comes is typically the best way to go about it, even if this means getting caught in a false break first. That is why we use stops. Can stop out and reverse to go in the opposite direction upon second confirmation (break of the top or bottom-side trend-line of the pattern). This is where the “max two entry” rule is good at keeping one’s self from getting chopped up.
USD/JPY 4-hr chart
USD/JPY Weekly chart

Resources for Forex Traders
Whether you are a new or experienced trader, we have several resources available to help you; indicator for tracking trader sentiment, quarterly trading forecasts, analytical and educational webinars held daily, trading guides to help you improve trading performance, and one specifically for those who are new to forex.
---Written by Paul Robinson, Market Analyst
You can follow Paul on Twitter at @PaulRobinsonFX


