


Talking Points:
- USD/JPY Technical Strategy: Little market conviction above 115 since mid-January
- BoJ Meeting Expected To Provide Less Volatility Than FOMC
- Previous Post: USD/JPY Technical Analysis: Retail Buyers Load In Before Trump Speech
- SSI is currently +2.0177 onUSD/JPY as 67% of retail traders are currently long: To stay up with the Speculative Sentiment Index, please click here.
This week should be exciting give a BoJ and FOMC meeting are on the books, but only one central bank meeting is expected to bring the price volatility that many traders are desperately seeking. On Wednesday, when Janet Yellen gives her press conference after what is expected to be a rate hike, many traders will look to see if guidance is provided on the pace of hikes for the rest of 2017 with a possibility that four hikes could be the expectation from the median DOT.
The risk from Japan will seem to focus on whether or not BoJ policymakers, as well as rhetoric from the weekend's G20 Finance Minister meeting in Germany, will show Japan’s concern with the new US Trade Policy.
USD/JPY has given Bulls and Bears little to cheer about for most of 2017. After a start lower after the December 14 rate hike, USD/JPY has seemed to respect resistance more than support, and many traders are looking to the potential for a rising median DOT on the Fed DOT Plot to help give Bulls and edge past resistance.
If you are looking for trading ideas, unlock our Trading Guides
Technical Analysis: There is a firm layer of resistance that starts at the recent session high of 115.20, with the March 10 high (115.51), and January 9 low (115.96) acting as firm resistance overhead. Many traders wanting to get long are likely looking for a close above this zone between 115 resistance points to engage with a long-term view back toward the 118-zone.
USD/JPY seems directionless on the short-term charts but continues to trade in the lower-quartile of a longer-term Bullish channel that began its ascent in September. The support that many traders will likely be watching if they do not have the Pitchfork and Ichimoku Cloud drawn is the 55-DMA at 114.209. A close below the DMA may indicate that we could see a test of support at the range low at 111.59.
Sentiment: Traders who utilize sentiment via SSI in their analysis should note the rise of long orders in USD/JPY. SSI is currently +2.0177 on USD/JPY as 67% of retail traders are currently long. We use our SSI as a contrarian indicator to price action, and now that the majority of traders are increasing net-long exposure provides asignal thatUSDJPY may have downward pressure
Interested in Joining Our Analysts, Instructors, or Strategists For a Free Webinar? Register Here
D1 USD/JPY Chart: USD/JPY Trading Within Firm Consolidation Range of 115.12/111.59
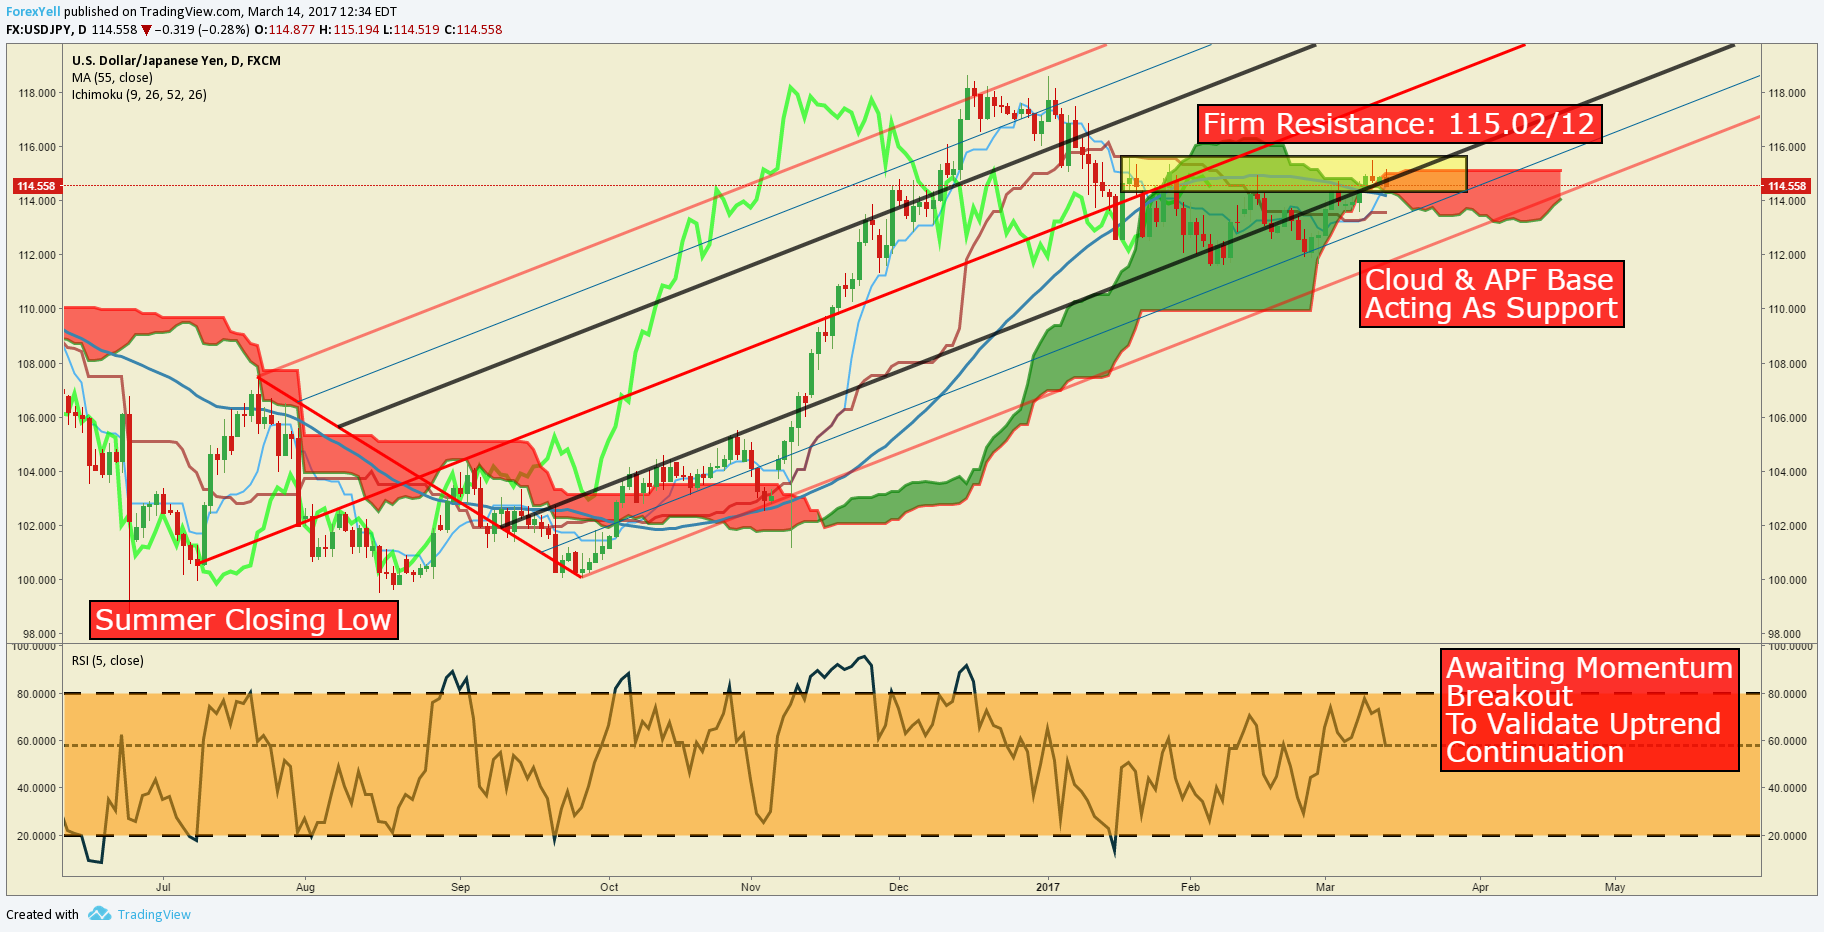
Chart Created by Tyler Yell, CMT
---
Shorter-Term USD/JPY Technical Levels: Tuesday, March 14, 2017
For those interested in shorter-term levels of focus than the ones above, these levels signal important potential pivot levels over the next 48-hours.

Contact and discuss markets with Tyler on Twitter: @ForexYell


