


Talking Points:
- USD/JPY Technical Strategy: recent breakdown below H4 Ichimoku Cloud is worrisome for Bulls
- Price below 117.53 should cause caution for traders that desire to be long
- SSI is currently -1.195 on USD/JPY as 56% of traders are currently short: To stay up with the Speculative Sentiment Index, please click here.
- If you’re looking for trading ideas, check out our Trading Guides.
Given the strong move higher in the USD and its index to close out 2016, many traders are anxiously anticipating the next big move higher. Naturally, the relative weakness of JPY has traders also looking to play any rebound higher in DXY via USD/JPY. However, looking at the technical picture and a potentially narrowing yield spread between US and JGBs, we should point out a few key hurdles that USD/JPY needs to overcome before Bulls should get excited again.
The chart below shows two bias or trend filters with Ichimoku Cloud and an Andrew’s Pitchfork Channel. When Price is below the Ichimoku cloud, the price is either correcting an uptrend or in a downtrend. Typically, we look for multiple price reactions off the cloud before we turn opinion from correction to downtrend. Through much of the last week of trading, the price of USD/JPY has traded below the cloud, which currently favors the corrective view, though a correction could still result in significant losses for a trader with a poor long entry even if the long-term uptrend remains Bullish.
We would like to see the price break above the H4 /240minute cloud before confidently saying the trend correction lower is likely over. For traders that want to associate that view with a specific price, the January 8 high of 117.53 would be a good place to start.
The second form of technical analysis added to the chart is an Andrew’s Pitchfork, which is drawn off three key pivots and has done an excellent job of framing price action. What is helpful about the Pitchfork in addition to the cloud is that they offer complementary views and a break above the Pitchfork channel would also validate trend resumption and would accompany a move of price above the cloud and 117.53 resistance.
However, if the price remains below 117.53, and fails to close above the Pitchfork channel as well as the cloud, it could be that it’s too early to presume the move higher in USD/JPY is beginning. Conversely, we could be looking at a move down toward the 23.6% Fibonacci Retracement of the Post-Election Rally highlighted in this article at 114.53.
Interested in Joining Our Analysts, Instructors, or Strategists For a Free Webinar? Register Here
H4 USD/JPY Chart: USD/JPY Breaks Below Ichimoku Cloud, Trading Within Falling Channel
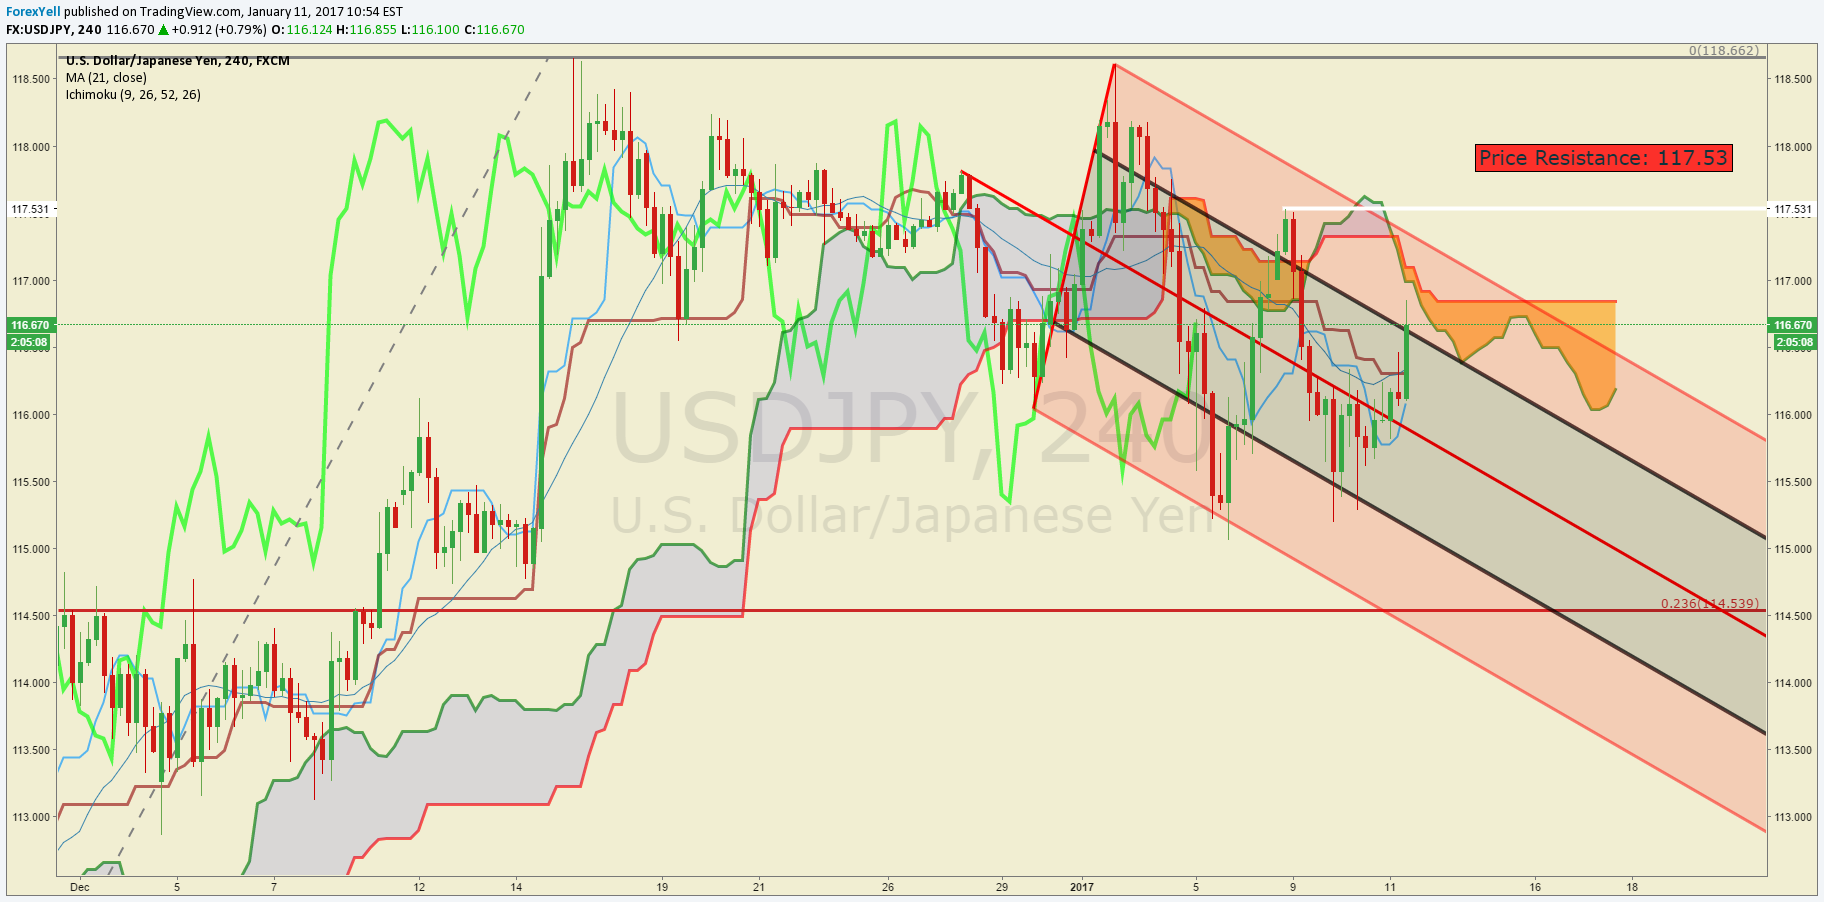
Chart Created by Tyler Yell, CMT, Courtesy of TradingView
Shorter-Term USD/JPY Technical Levels: January 11, 2017
For those interested in shorter-term levels of focus than the ones above, these levels signal important potential pivot levels over the next 48-hours.

Contact and discuss markets with Tyler on Twitter: @ForexYell


