


Talking Points:
- USD/JPY Technical Strategy: low volatility in USD/JPY tends to beget high volatility, be warned
- Yield spread tightening biggest downside risk for USDJPY
- USD/JPY Trying to Put in a Ceiling at Mid-118.00s?
Our last piece highlighted the potential for a pullback developing on swing charts. Given the strength of the uptrend that has relied on the Bank of Japan playing to lose the yield spread game via Yield Curve Control, caution should be exercised on the strength of move lower above the December 30 low of 116.04.
The important thing to note with USD/JPY given the previous price action that has traded sideways since the Federal Reserve announced on December 14 not only a 25 basis point rate hike that was widely expected, but shifted higher the median Dot Plot by 25 basis points, which nearly acted as a twofold like on December 14. Given the surprise of the higher Dot Plot, many traders are focused on Wednesday’s FOMC Minutes that will help explain in detail the view held inside the Fed about future monetary policy given the easing bias held by other developed country central banks.
Before we dive into the charts, it is worth noting that sideways moves in USD/JPY tend to proceed a strong move so traders should be warned. The chart below highlights periods of consolidation in USD/JPY that eventually led to sharp moves.
Specifically, traders keep an eye on support at 116.04, the December 30 low, because a break there could open up a sharp retracement against the post US election rally that is caused USD/JPY to appreciate by 17%. Two levels to watch on a further breakdown would be the 23.6% retracement at 114.53 followed by the 38.2% retracement of the post-election rally at 112. A hold of 116.04 could mean the strong rally set to continue and move toward the 2016 high of 121.63 is in the works.
As mentioned above, the Bank of Japan is doing everything in their power to keep the yield spread as wide as possible, which has extended the effect of the rise in U.S. Yields. Any tightening of the yield spread between UST & JGBs would likely be a catalyst for retracement, even a short-lived one.
D1 USD/JPY Chart: USD/JPY Notorious For Trading Sideways Before Big Moves
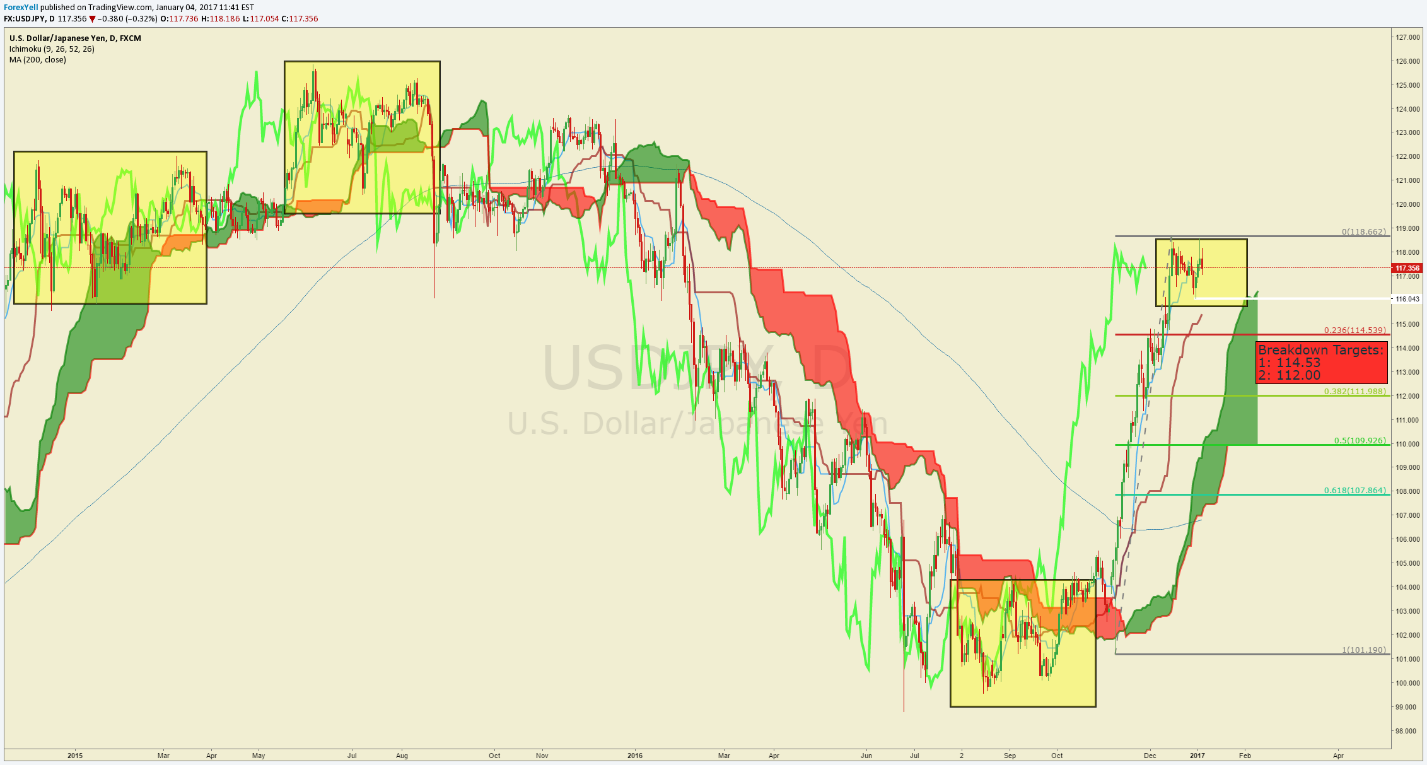
Chart Created by Tyler Yell, CMT, Courtesy of TradingView
Shorter-Term USD/JPY Technical Levels: January 4, 2017
For those interested in shorter-term levels of focus than the ones above, these levels signal important potential pivot levels over the next 48-hours.


