Talking Points:
- USD/JPY Technical Strategy: Too Strong To Fight, But Approaching Major 61.8% Fib
- Widening Sovereign Yields Providing Fundamental Support for USD/JPY
- Tenkan-Sen In Ichimoku Provides Clear Guidance On Reading The Trend
Do you remember when we said, ‘Yield Curve Control,’ out of Japan as the new Monetary Policy tool of choice was a big deal? The extreme run-up in U.S. 10yr Yields has helped amplify that view as the spread between Japanese Government Bonds (JGBs), and the US 10-Year Treasuries are at their widest since at least 2011 when Abenomics began.
To make things easier for readers new to looking at yields spread, the US/JP yield spread is effectively the US10yr given Japan has pegged the 10yr to 0%. Given the significant driver, this has been to JPY weakness; there is an argument to be made that a further run higher in the US10Yr yield count continue to provide USD/JPY with more upside.
Access Our Free Q4 Trading Guides That Focus On Tradeable Themes Here
Next week, traders will see a lot of volatility and the bond and FX market will be in focus as the Federal Reserve shares their policy outlook. This meeting will be the only Fed meeting during the presidential “lame-duck” period, and before three regional Fed presidents who average as more dovish view of monetary policy begin to vote.
Additionally, much focus will be placed on how Janet Yellen anticipates navigating Federal Reserve policy through what is believed to be inflationary fiscal policy out of the United States. Anything thing she says that causes yields to continue moving higher in the U.S., which would further widen the US/JP yield spread would presumably continue to support USD/JPY to higher prices.
H4 USD/JPY Chart: USD/JPY Breakout From Triangle Turns Focus on 116.60

Chart Created by Tyler Yell, CMT, Courtesy of TradingView
The chart above that show’s the very strong post-election rally is designed to point out two main points. First, the Ichimoku cloud on the 240-minute chart is providing excellent support on the trend breakout in USD/JPY. A failure for the price to break below the 240-minute cloud without momentum (the lagging line) following close behind will encourage many traders to remain long or out of the trade.
For those comfortable with Ichimoku, I’ve added a moving average on the chart in white that is calculated in a similar fashion as the Tenkan-Sen on the daily chart. There is a lot of similarities here between the Daily Tenkan-Sen and the H4 Cloud, but the spirit is the same. As for price trading above these initial lines of support, there is arguably too much momentum to fight for swing or multi-day holding period traders that are hoping to catch a reversal.
Register for a Free Price Target Webinar Hosted by Tyler Yell, CMT on Tuesdays, 3 pm EST
The second focal point of the chart that shows a near vertical move is a focus on resistance in the 115.47/87 zone. While the trend is expected to extend as the fundamental factors remain in play, there should be a focus on the August 24, 2015, low of 115.87, which developed at the apex of a mini-flash crash on worries of liquidity and China after their initial Yuan devaluation. 115.47 is the 61.8% Fibonacci retracement level of the 2015-2016 range.
For now, the burden of proof is on USD/JPY bears. Should price resistance develop in the upper-115 region alongside a break below the 240-minute Ichimoku cloud or Daily Tenkan-Sen, we could then credibly say that a larger price trend correction is upon us. However, until we see such a development, we’ll continue to favor further upside.
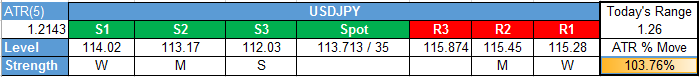
Shorter-Term USD/JPY Technical Levels: December 9, 2016
For those interested in shorter-term levels of focus than the ones above, these levels signal important potential pivot levels over the next 48-hours.