


Talking Points:
- USD/JPY Technical Strategy: corrective move toward cloud now worrisome for now
- JPY strength emerging as VIX jumps to 7-week high, likely temporary
- Bank of Japan Extended Time They Expect To Hit New Inflation Target
USD/JPY price has continued to drop after the Bank of Japan extended their forecast for being able to achieve inflation in excess of 2%. A key component of JPY strength on Tuesday was the risk-off sentiment that took hold with the VIX hitting 7-week highs after jumping 8%.
While the U.S. Presidential election will continue to provide market uncertainty until the final votes are tallied, there were other economic reports like ISM that made traders ready to off-load USD. The October ISM manufacturing did beat in some area like employment, which is encouraging ahead of NFP on November 4 there was disappointment in the low growth of inventory.
Access Our Free Q4 Trading Guides That Focus On Tradeable Themes Here
The move lower should be watched as the DXY comes under pressure with Fed uncertainty after the priced in hike in December. Wednesday will provide the markets with an FOMC meeting that is expected to prepare the markets for a December hike, but it is hard to see the Fed hiking a second time as a there isn’t a probable hike that would take the reference rate to 0.75-1.00 through the December 13, 2017 meeting.
D1 USD/JPY Chart: Retracement Targets 103.52/102.80
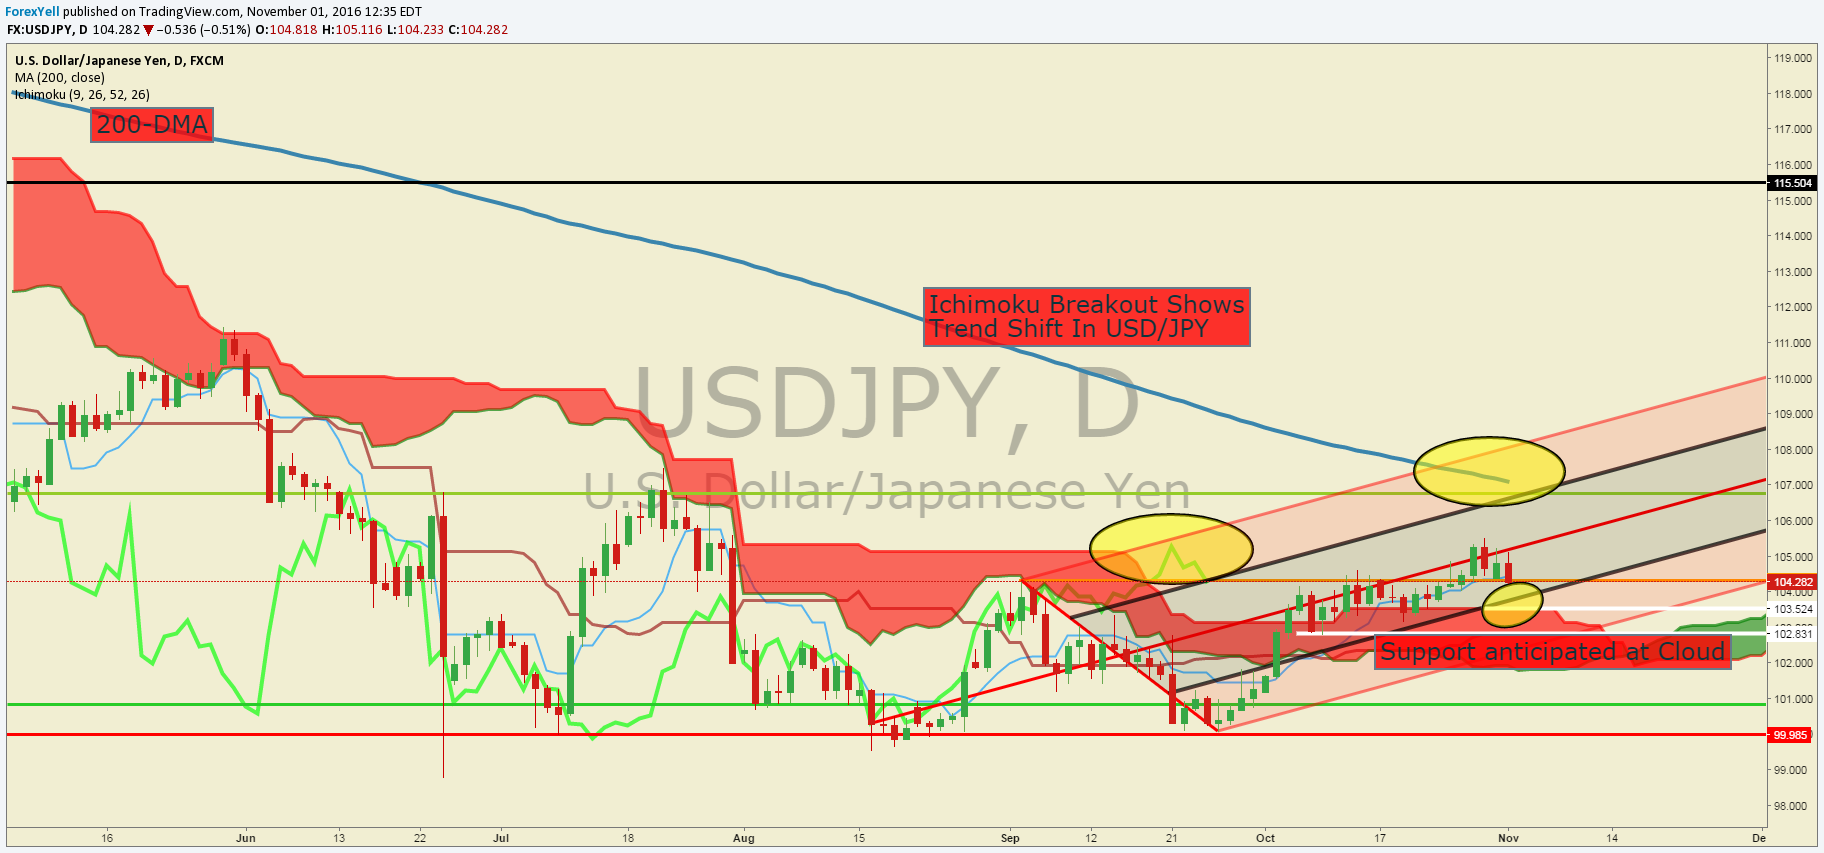
Chart Created by Tyler Yell, CMT, Courtesy of TradingView
The charts are providing a helpful reference point as the correction develops through the initial level of Ichimoku Support at the 9-day mid-point. The zone worth focusing for short-term technical analysis would be the October 20 high at 104.20 followed by 104.02, the October 26 low.
On the chart above, we’ve looked at JPY breaking down as an indication that an Elliott Wave signal could be giving way to a move higher, and price above the Ichimoku cloud would favor an advance too. While USD/JPY consolidates, we’ll continue to favor the upside if price holds above 102.70. The upside that we’re favoring is the double-bottom (mid-August & late-September lows) that targets the 100% extension of the range at 108.557.
Another key indicator that we could see price test on a Bullish advance is the 200-DMA that sits at 107.10.
Shorter-Term USD/JPY Technical Levels: November 1, 2016
For those interested in shorter-term levels of focus than the ones above, these levels signal important potential pivot levels over the next 48-hours.


