


Talking Points:
- The Bank of Japan hosted a rate decision last night and, once again, delayed their timeframe for reaching their inflation target of 2%. Previously the goal was March of 2018; now it looks as though the bank isn’t expecting to hit their target until after BoJ Governor Haruhiko Kuroda has left the post.
-The U.S. Dollar has been exceptionally weak since news broke on Friday about a re-opening of the investigation in to Hillary Clinton’s emails. With the Fed meeting tomorrow and then Non-Farm Payrolls on Friday – the opportunity certainly exists for a hastening or reversal of this theme in USD.
-If you’re looking for trading ideas, check out our Trading Guides.
To receive James Stanley’s Analysis directly via email, please sign up here.
At last night’s Bank of Japan meeting, the bank held rates flat while adjusting the target to reach their inflation goal of 2%. Coming into last night’s meeting, the bank had already posed numerous delays to their inflation target. Most recently, the BoJ adjusted their target for reaching their 2% inflation goal by March of 2018, which is just one month before the end of BoJ Governor Haruhiko Kuroda’s tenure atop the bank.
Last night’s forecast said that the BoJ expects that inflation will increase towards 2% in the second half of a period that runs to March of 2019. And considering that there are approximately 28 months until we reach March of 2019, this would mean that the bank isn’t expecting to reach 2% inflation until after Mr. Kuroda has left office. Or, to put it otherwise, hitting that target will likely be somebody else’s problem.
Nonetheless, these moderated inflation expectations helped to bring on Yen weakness as investors factored in an even more dovish Bank of Japan. On the chart below, we’re looking at EUR/JPY after last night’s BoJ meeting.
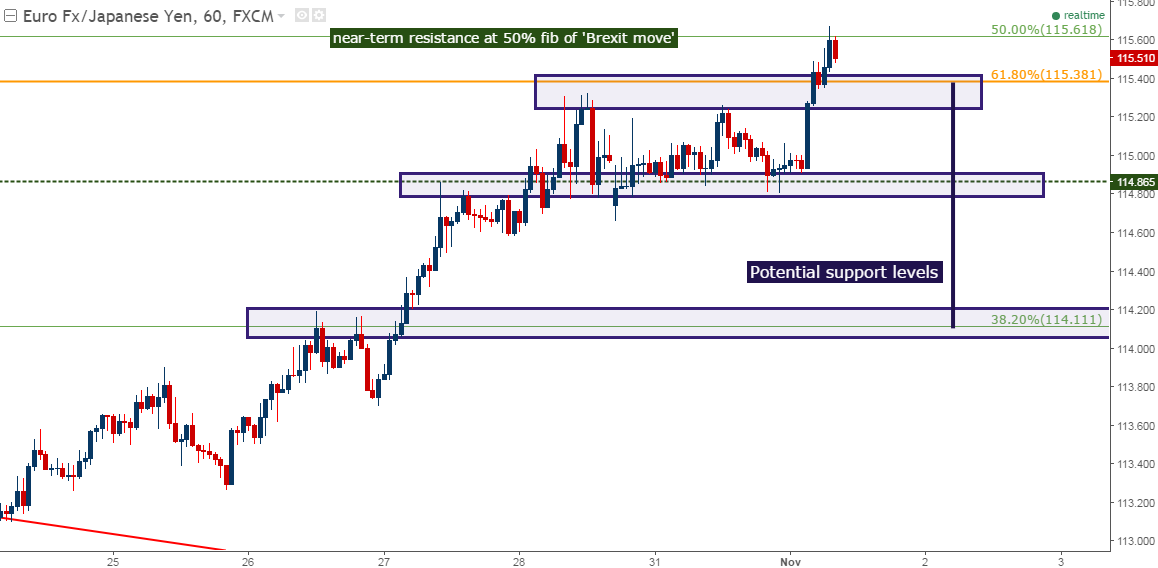
Chart prepared by James Stanley
USD down to support
We looked at the US Dollar last Friday in anticipation of a heavy slate of U.S. economic drivers for this week. Wednesday brings FOMC, Friday brings Non-Farm Payrolls and Tuesday of next week brings U.S. Presidential elections. So the next week is likely going to be pretty volatile for the Greenback.
But before we could even get to any of those major drivers, the US Dollar has staged a sell-off to move down to a very interesting support level around the 98-handle on DXY. On the chart below, we’re looking at an upward-sloping trend-line that’s functioned as support in the Dollar since October 11th, and just a bit lower around the 97.50 level we have a major psychological level that had also functioned as the July swing-high in DXY.

Chart prepared by James Stanley
Weak Dollars, Weak Yen – Weakness Bias Goes to the Yen
While both the U.S. Dollar and Japanese Yen have been weak in the overnight session, one of these currencies carries a capacity for significantly more long-term weakness than the other. The U.S. Dollar is weak on fear that volatility in U.S. Presidential elections may delay the Fed’s rate hike plans. The Japanese Yen, on the other hand, is weak because the BoJ kicked their inflation targets even deeper into the future with little hope of hitting that target in the near-term. So, traders may assign this bout of USD weakness as ‘more temporary’ than what we might see in the Japanese Yen. On the hourly chart below, we’re looking at USD/JPY working within a bullish trend-channel.

Chart prepared by James Stanley
Oil Move is Still Panic-Prone, but we’re at Support
We wrote about the move in Oil yesterday in consideration of the longer-term technical formation. There is an 18-year trend-line at work in Oil prices right now that had previously helped to catch the lows of the Financial Collapse and, more recently, has been a point of support and then resistance over the past 22 months. Yesterday was key because October saw another resistance inflection off of this trend-line. Had prices closed above the trend-line for the month of October, the prospect of a ‘bigger picture’ reversal wouldn’t’ have been nearly as attractive. But with that resistance inflection, the door stays open for bearish plays in Oil in the months ahead. On the chart below, we’re looking at the longer-term trend-line.

Chart prepared by James Stanley
For traders that are looking to integrate bearish plays on Oil, they’d likely want to wait for resistance to show before triggering. In yesterday’s piece, we looked at four potential support levels in Oil and price action has already ran through the closest, and is now sitting near the ‘S2’ level. And while the move certainly may continue, traders would probably want to wait for price action to exhibit some form of support before looking to trigger short. We look at the updated chart below, along with an area highlighted in which that resistance may show.

Chart prepared by James Stanley
--- Written by James Stanley, Analyst for DailyFX.com
To receive James Stanley’s analysis directly via email, please SIGN UP HERE
Contact and follow James on Twitter: @JStanleyFX


