


Talking Points:
- USD/JPY Technical Strategy: Bullish Break > Ichimoku Cloud & 100-DMA turns focus higher
- Bank of Japan's QQE Weapon of “yield curve control,” may be used to prevent competitive disadvantage to China's falling off-shore Yuan
- USD/JPY > 100-DMA (103.67), all focus now on 104.32 (Triangle Invalidation)
Access Our Free Q4 Trading Guides That Focus On Tradeable Themes Here
To oversimplify how FX has changed since the Financial Crisis of 2008, currencies do not move alone. The strong move of one currency provides a comparative advantage or disadvantage to another economy, which a central bank will tend to fight to ensure they are not sitting at an absolute economic disadvantage.
On Monday, the Chinese Renminbi (off-short Yuan) fell by its largest amount in four months after China opened following National Day Golden Week holiday. The drop amounted to 0.46% for the Yuan but continues to validate the trend of a stronger USD and weaker CNH. The weakening took the Yuan to its lowest level (6.7501) since September 2010 according to Bloomberg data.
2-Year USD/CNY Chart Shows Accelerating Off-Shore Yuan Weakness

Chart Created by Tyler Yell, CMT, Courtesy of TradingView
The weakening aligns with China FX reserves shows a rising amount of capital is leaving. The increase in capital flows could bring volatility to global markets as the world awaits the next move by the Federal Reserve that could bring down the Yuan and is encouraging wealthy citizens of China to move their money overseas in yuan amid Yuan depreciation expectations.
So why all this talk about the CNY weakness? In short, the Yuan weakness gives China a comparative and possibly absolute manufacturing and export advantage that could encourage the aggressive fiscal policy stimulus that would naturally align with the “yield curve control’ announced on September 21.
The significance of the CNY devaluation to six-year lows is what it may encourage Japan to do that would also weaken the JPY, and therefore encourage an impressive set-up for a long USD/JPY trade (not a trade recommendation.)
USD/JPY Accelerates Toward 104.32 Invalidating Bearish Corrective Pattern
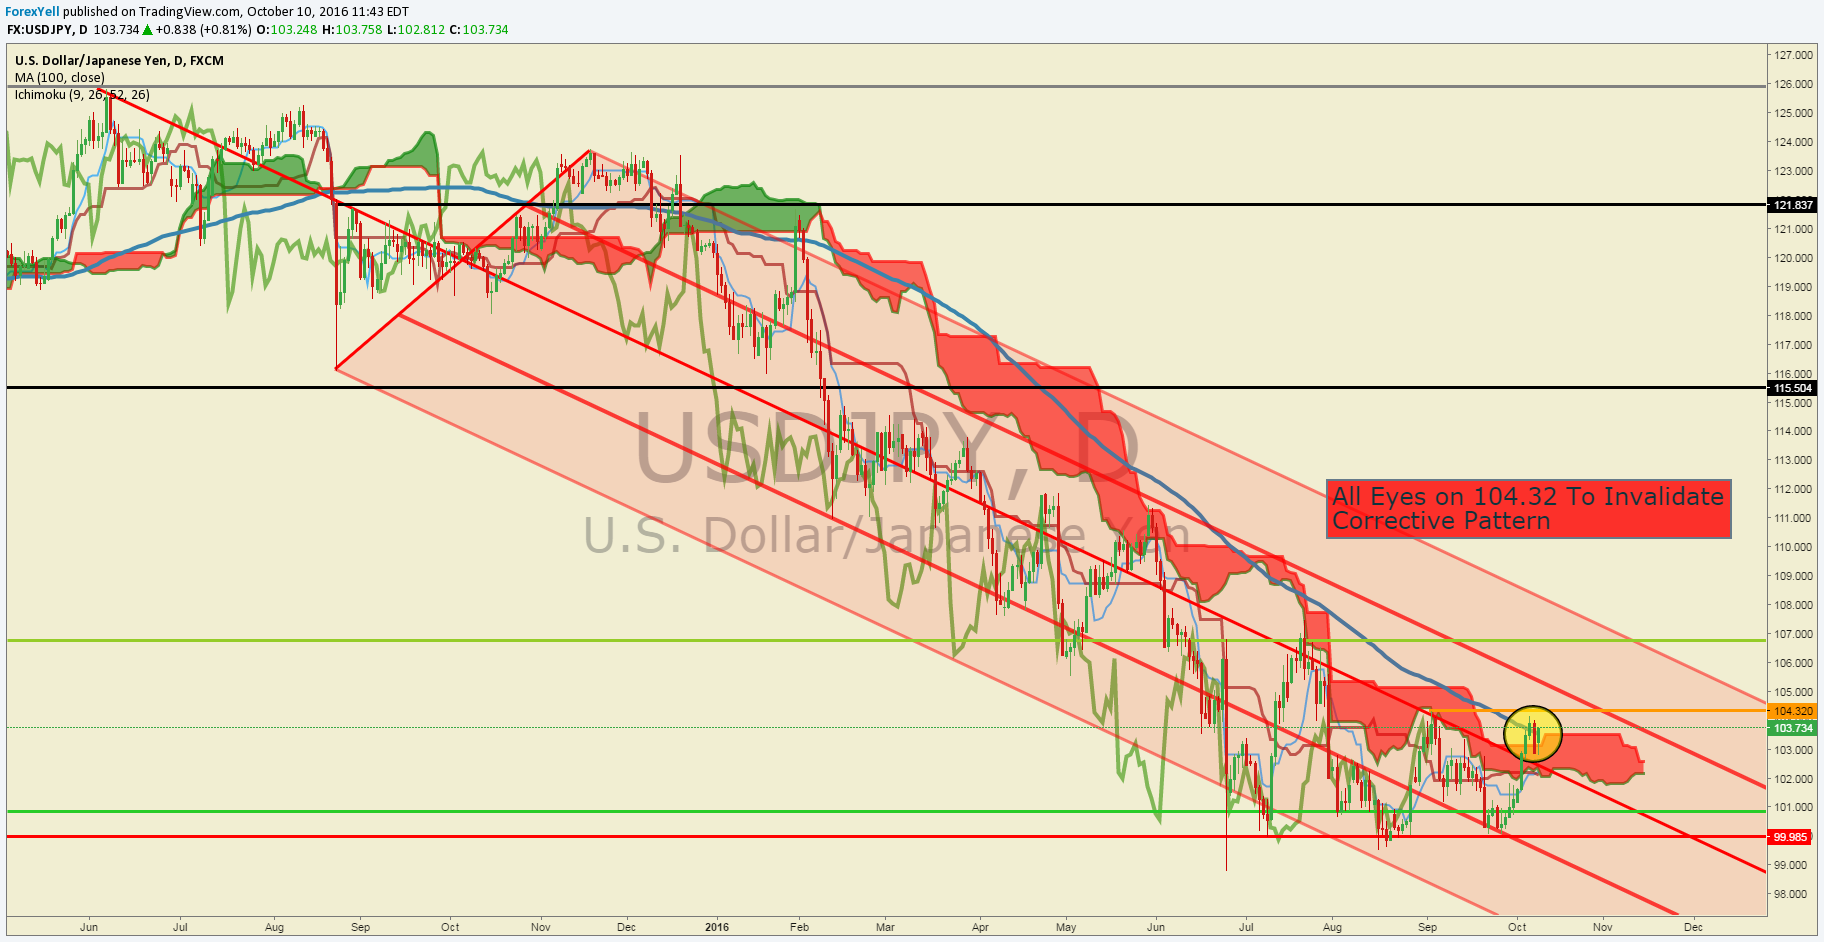
Char Created by Tyler Yell, CMT Courtesy of Trading View
Looking above, you can see what appears to be a very clear downtrend as highlighted by Andrew’s Pitchfork (Red). The long-term trend shows the path of least resistance, but it is worth being watchful for signs of a trend change that may be developing. The move above the 100-DMA (103.67) and the basing above Ichimoku Cloud on the chart above that may be the first firm green shoots of a bullish development.
When looking for a reversal of a year-plus-long trend, it’s helpful to take a page out of Bayesian probability that looks for moments of proof of the pending hypothesis that the trend is turning. In other words, utilizing a few scenarios that would validate the trend change, which is a rare event.
Some traders have looked at the move in USD/JPY post-Brexit as a triangle. That’s a valid view, but a break above 104.32 (September Opening Range High) that would invalidate such a pattern and could add to the building evidence of a pending bullish breakout. A break above 104.32 would then turn Bullish focus to the post-Brexit high of 107.48.
In previous market notes, we’ve discussed how Ichimoku Cloud would be one of the first long-term indicators to register a Bullish signal on a break and close above 103.20 on the daily chart. We seem to have that, but now the focus will be on 104.32 to see if the corrective triangle pattern is invalidated.
Another thing to note over the coming trading days is the opening range high of October at 104.15. Opening Range reversals are commonplace in strong trends and should be indicative of trend continuation. In the case of October, we’d have an opening range reversal if the price of USD/JPY broke below 101.17 (Monday’s low) in the second week of October and continued lower. However, a break above the high of 104.15 on a closing basis would further embolden USD/JPY bulls. Given the significant macro-event risk of the US Presidential Election, the opening range low of 101.17 should remain on watch as an invalidation of the recent excitement.
A continuation through the resistance levels mentioned above could see traders start to push the market higher in fear of missing out on the next USD/JPY long trade.
Shorter-Term USD/JPY Technical Levels: October 10, 2016
For those interested in shorter-term levels of focus than the ones above, these levels signal important potential pivot levels over the next 48-hours.

Access Free Real-Time News Coverage and Strategy Sessions in Our Live Trading Room


