Talking Points:
- USD/JPY Technical Strategy: favoring further downside & following the trend
- 200-Week Moving Average remains the line in the sand (106.81)
- The lack of desired-BoJ action favors another sub-100 run
Access Our Free Q3 JPY Outlook As Pressures Mount on BoJ & the Federal Reserve Here
The BoJ Threat Was Disappointing
As of Friday, USD/JPY has fallen over 3% as the Bank of Japan disappointed anapparent QE-Hungry Market. Given the strong breakdown toward the end of July, the price chart looks ready to test and possibly break historically significant support in the ~101 zone. Over the last 17 years, we’ve seen pivots in this zone. However, we’re as uncertain as ever on whether or not a base is forming, or more downside is likely.
A helpful market that aligns nicely with the direction of JPY is XAU. Put another way, USD/JPY & XAU/USD have a very clean inverse correlation. The weak US GDP seems to have compounded the effects of the BoJ’s stimulus that left out additional Bond-Purchases and potential ‘Helicopter Money.’
As of July 29, the JPY has strengthened by up ~15% YTD. Given the post-negative interest rate announcement JPY strength on such a dovish policy announcement, few are expecting support at ~101 to hold.
Find The Habits That Emerged From Successful Traders When We Studied 10’s of Millions Real Trades
USD/JPY Continues To Knife Through Key Support On Unrelenting JPY Strength
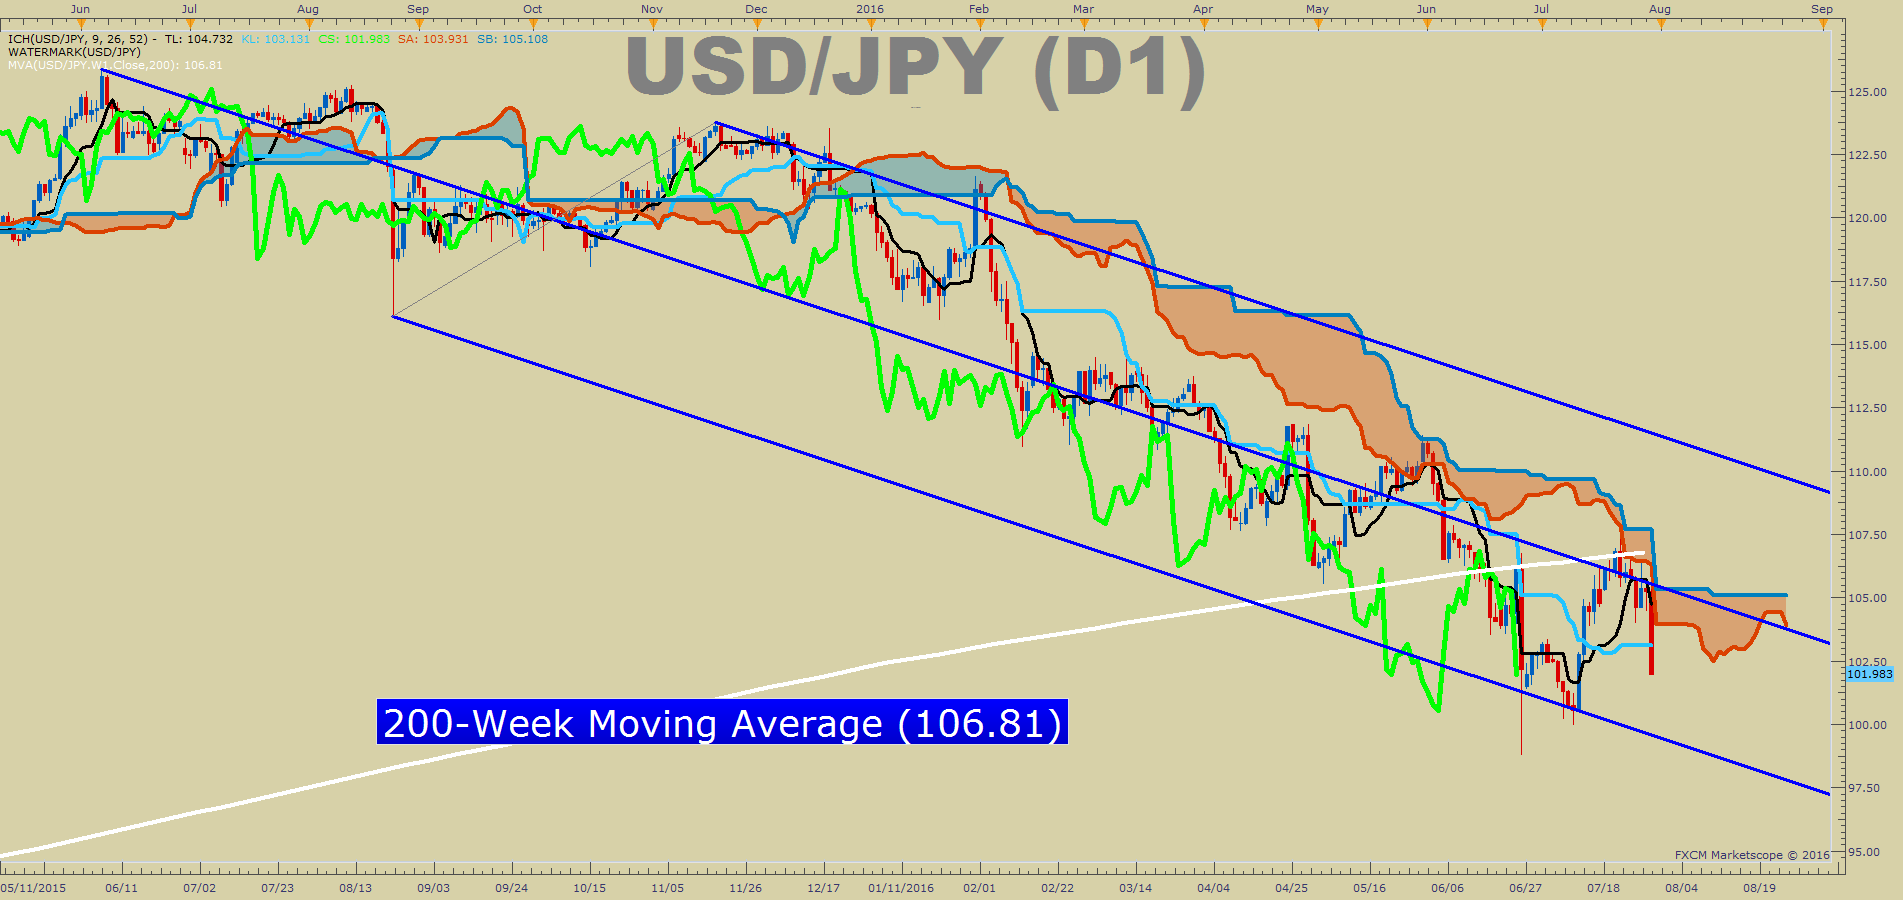
Looking above, you can see what appears to be a very clear downtrend alongside a 200-WMA (currently at 106.81). The chart above does not show the long-term significance of the 200-WMA, but the break below favors further downside and the 200-WMA should be treated as significant resistance. Only a sustained break above the 200-WMA would tilt the bias for JPY Selling.
You will also notice that Andrew’s Pitchfork (Blue) and the Ichimoku Cloud bring clarity to prefer the downside continuation.
The last time the price of USD/JPY broke below the 200-Week Moving Average was in 2008 at the ~113 level where the price would eventually fall to 75.55 for a ~33% drop. Subsequently, USD/JPY traded above the 200-WMA at ~85 in late 2012, and the recent break was the first break since 2012.
Currently, the greater fear is that we are entering not only a more volatile currency cycle but a time of renewed JPY strength, which is a global risk-negative for currencies. JPY strength has recently abated, but after a disappointment on July 29, markets could be fearing that central banks will have a hard time controlling market forces given they have provided most of the stimulus they can and are now searching for less tested/ trusted means of “price stability.”
The Technical Picture
The Bearish Price Channel (Blue) is drawn from the June 2015 High, the August 24 low and the November high. This channel has contained the price rather well, and until there is a sustained break above the channel median-line (105.60), which is roughly the July 29 high, it is difficult to say with a straight face that the Bull market may soon resume.
Shorter-term resistance will be at the Tuesday low of 103.98. If the 104 level holds as internal resistance, we could be starting another impulsive decline. Therefore, short-term sellers may look to exit if price breaks above 104, as the technical picture gets a bit messy.
When hope springs for a new uptrend, the first higher-low is typically the best place to focus. That high-low and significant current support is ¥99.975 per USD. Below the higher low, the Friday, June 24 low of 98.77 will be watched to see if there is any hope for JPY bears.
Below there, you can look to the 61.8% Fibonacci Retracement of the 2011-2015 range at 94.83. Given the recent volatility, a new breakdown could easily bring us to these levels. Should we break below these levels, expect to hear from the Bank of Japan.
However, USD/JPY Sentiment Shows Traders Still Have Hope For Upside
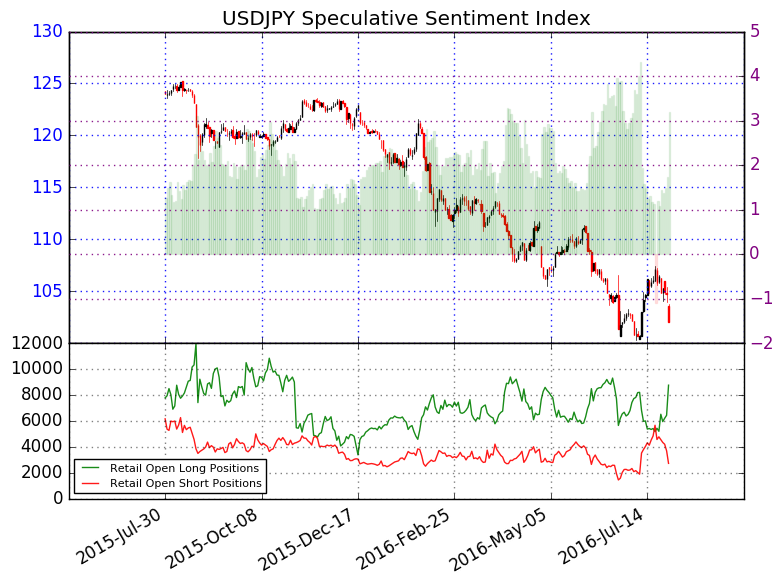
When looking at sentiment, the most pressing development is arise in new short positions. As of Thursday, the ratio of long to short positions in the USDJPY stands at 3.15 as 76% of traders are long.
To See How Live Clients Are Positioned In FX & Equities Click Here Now
Yesterday the ratio was 1.64; 62% of open positions were long. Long positions are 35.0% higher than yesterday and 78.6% above levels seen last week. Short positions are 29.8% lower than yesterday and 40.6% below levels seen last week. Open interest is 10.4% higher than yesterday and 15.6% above its monthly average.
We use our SSI as a contrarian indicator to price action, and the fact that the majority of traders are long gives signal that the USDJPY may continue lower. The trading crowd has grown further net-long from yesterday and last week. The combination of current sentiment and recent changes gives a further bearish trading bias.
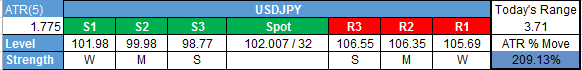
Shorter-Term USD/JPY Technical Levels: July 29, 2016
For those interested in shorter-term levels of focus than the ones above, these levels signal important potential pivot levels over the next 48-hours.