


Talking Points
-BOJ releases monetary statement July 29, traders anticipate stimulus or talk of helicopter money
-Technical structure appears bullish medium term, a break above 107.50 is significant
-If the correction lower continues, support may be found near 104.63, 103.90 or 103.50
Traders are talking about potential helicopter money flying over Japan. Though we don’t know if that will happen, mere talks about it has placed USD/JPY on trader’s radars.
BOJ meets at the end of next week and there is an anticipation of more stimulus arriving out of Japan. Should helicopter money (or other stimulus) be disbursed, it could potentially weaken the Yen and USD/JPY may take flight.
From a technical perspective, the picture is simple. It appears the pair is building a bullish pattern that could lead to much higher prices.
We wrote in our previous article how there is a cluster of resistance in the 106.30-107.30 price zone. If prices were successful in breaking higher and holding, this would be a significant technical development.
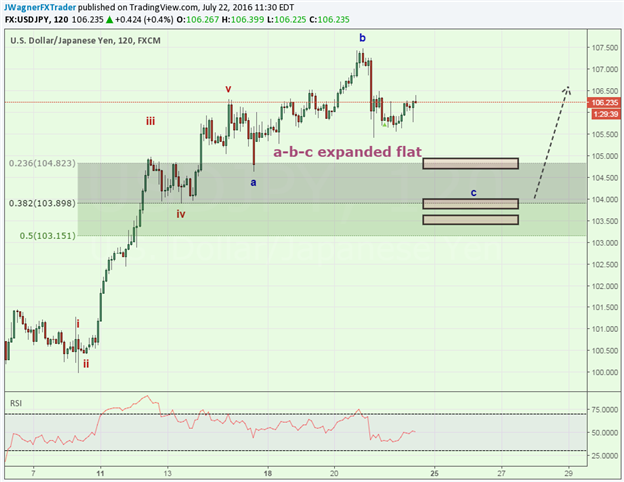
Using Elliott Wave analysis, it appears we have 5 waves higher and prices are correcting sideways to lower in 3 waves. This is a bullish sequence that often pre-empts another 5 waves higher of similar size and magnitude as we saw with the July 8 to July 14 increase.
Therefore, a break above the July 20 high of 107.50 could signal a continuation of the uptrend and that the correction is over.
We do think there is a higher probability chance of a move to slightly lower levels. If the correction is still in place, then the wave ‘a’ low of 104.63 is a potential target. Additionally, the 38.2% retracement level of 103.90 is another target. Lastly, we wouldn’t be surprised to see USD/JPY possibly trade down to 103.50. This last zone represents the distance of the ‘b’ wave overshoot in excess of wave ‘v’ and displaces it as a overshoot of the ‘a’ wave low.
How do we know which level is likely to hold?
Though we don’t know if the 107.50 level to the topside or 104.63, 103.90, and 103.50 to the downside will hold, we can use the Grid Sight Indicator to provide an indication of intraday momentum as price presses into one of these levels.
GSI is a big data indicator that compares the current price action to historical patterns and seeks out any matches. Based on those matches it sill share how many of the historical patterns moved higher ‘x’ pips and how many moved lower ‘y’ pips.
In the end, you can see if similar historic patterns produced support or resistance and use that in conjunction with your other analytical tools.
Learn more about GSI or use GSI on USDJPY ‘m3’ or ‘m5’ here.
Bottom line, if medium term technical pattern looks bullish up towards 111-115.
Having trouble trading USD/JPY? This may be why.
Interested in a quarterly outlook for USD and/or JPY? Download our quarterly forecast here.
---Written by Jeremy Wagner, Head Trading Instructor, DailyFX EDU
Follow me on Twitter at @JWagnerFXTrader .
See Jeremy’s recent articles at his Bio Page.
To receive additional articles from Jeremy via email, join Jeremy’s distribution list.


