USD/CHF Price Outlook, Charts and Analysis
- US Dollar looking ahead to Markit manufacturing PMI numbers today.
- USD/CHF bearish momentum continues.
Find out more about USD price outlook through mid-year, download for free Q2 major currencies forecasts
USD/CHF – The Buyers Failure
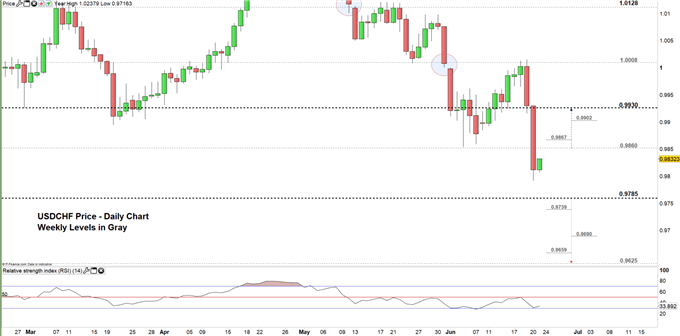
On June 7, USD/CHF bearish move stalled and the pair rallied in the following days but failed to overtake 1.0008 twice effectively capping any start of an uptrend. As such, the sellers did not miss the opportunity and sent the price to print its lowest levels in over five months at 0.9792.
Alongside, on June 12 the Relative Strength Index (RSI) pointed higher however, it failed on June 18 to cross above 50 to start a bullish momentum, reflecting the likelihood of the bearish momentum continuation.
Just getting started? See our Beginners’ Guide for FX traders
USD/CHF Daily Price Chart (Feb 25, 2019 - June 21, 2019) Zoomed in

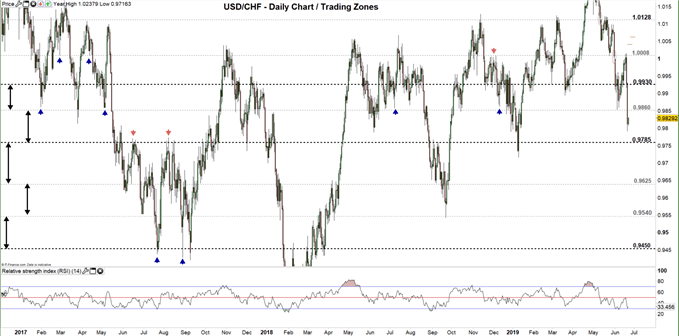
USD/CHF Daily Price Chart (DEC 5, 2016 – June 21, 2019) Zoomed Out

Looking at the Daily chart, we notice that USD/CHF is eying to test 0.9860. Therefore, a close above this level could send the price higher towards the higher end of the current trading zone 0.9785 – 0.9930 however, the weekly resistances highlighted on the chart need to be watched along the way.
Any failure to close above 0.9860 could mean more bearishness towards the lower end of the trading zone at 0.9785. A close below this level might lead the pair even lower towards 0.9625. See the chart to find out more about where the price could find support in this scenario.
Having trouble with your trading strategy? Here’s the #1 Mistake That Traders Make
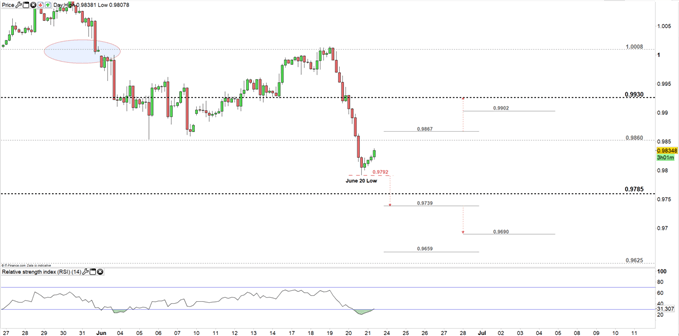
USD/CHF Four-HOUR PRICE CHART (May 24 – June 21, 2019)

Looking at the four-hour Chart, we notice yesterday USD/CHF rebounded from 0.9792. Therefore, if the price falls below this threshold it could trade lower towards 0.9739 contingent on clearing the lower end of the trading zone mentioned above. See the chart for more key levels if the selloff continues beyond mentioned levels.
On the other hand, any rally above 0.9867 could send USD/CHF towards 0.9930. See the chart for the key weekly resistance needs to be kept in focus.
Written By: Mahmoud Alkudsi
Please feel free to contact me on Twitter: @Malkudsi


