


USD/CHF Price Outlook, Charts and Analysis
- US Dollar looking ahead to CPI numbers today, and CHF for SNB interest rate decision tomorrow.
- USD/CHF Bearish Momentum on Hold.
Find out more about USD price outlook through mid-year, download for free Q2 major currencies forecasts
USD/CHF – Bears Hesitation
On Jun 5, USD/CHF declined to its lowest level in nearly five months. The price rallied after closing with a long legged Doji, showing bears hesitation in pushing the price lower. Since then the pair has remained in the current trading zone (0.9860 – 1.0008).
The Relative Strength Index (RSI) tested the oversold territory on Jun 6 however, abandoned it on the following day highlighting the bearish momentum weakness.
Just getting started? See our Beginners’ Guide for FX traders
USD/CHF Daily Price Chart (Oct 15, 2018 - June 6, 2019) Zoomed in

USD/CHF Daily Price Chart (NOV 1, 2016 – June 12, 2019) Zoomed Out

Looking at the Daily chart, we notice USD/CHF eying to rally to the current trading zone high end at 1.0008after failing twice last week to close below the low end at 0.9860. However, any rally to the high end needs to consider the weekly resistance levels at 0.9950 and 0.9982.
On the flipside, if the bears retake the initiative then a close below 0.9860 may send the price lower towards 0.9786. However, the weekly support levels at 0.9823 and 0.9808 need to be watched along the way.
Having trouble with your trading strategy? Here’s the #1 Mistake That Traders Make
USD/CHF Four-HOUR PRICE CHART (May 16 –30, 2019)
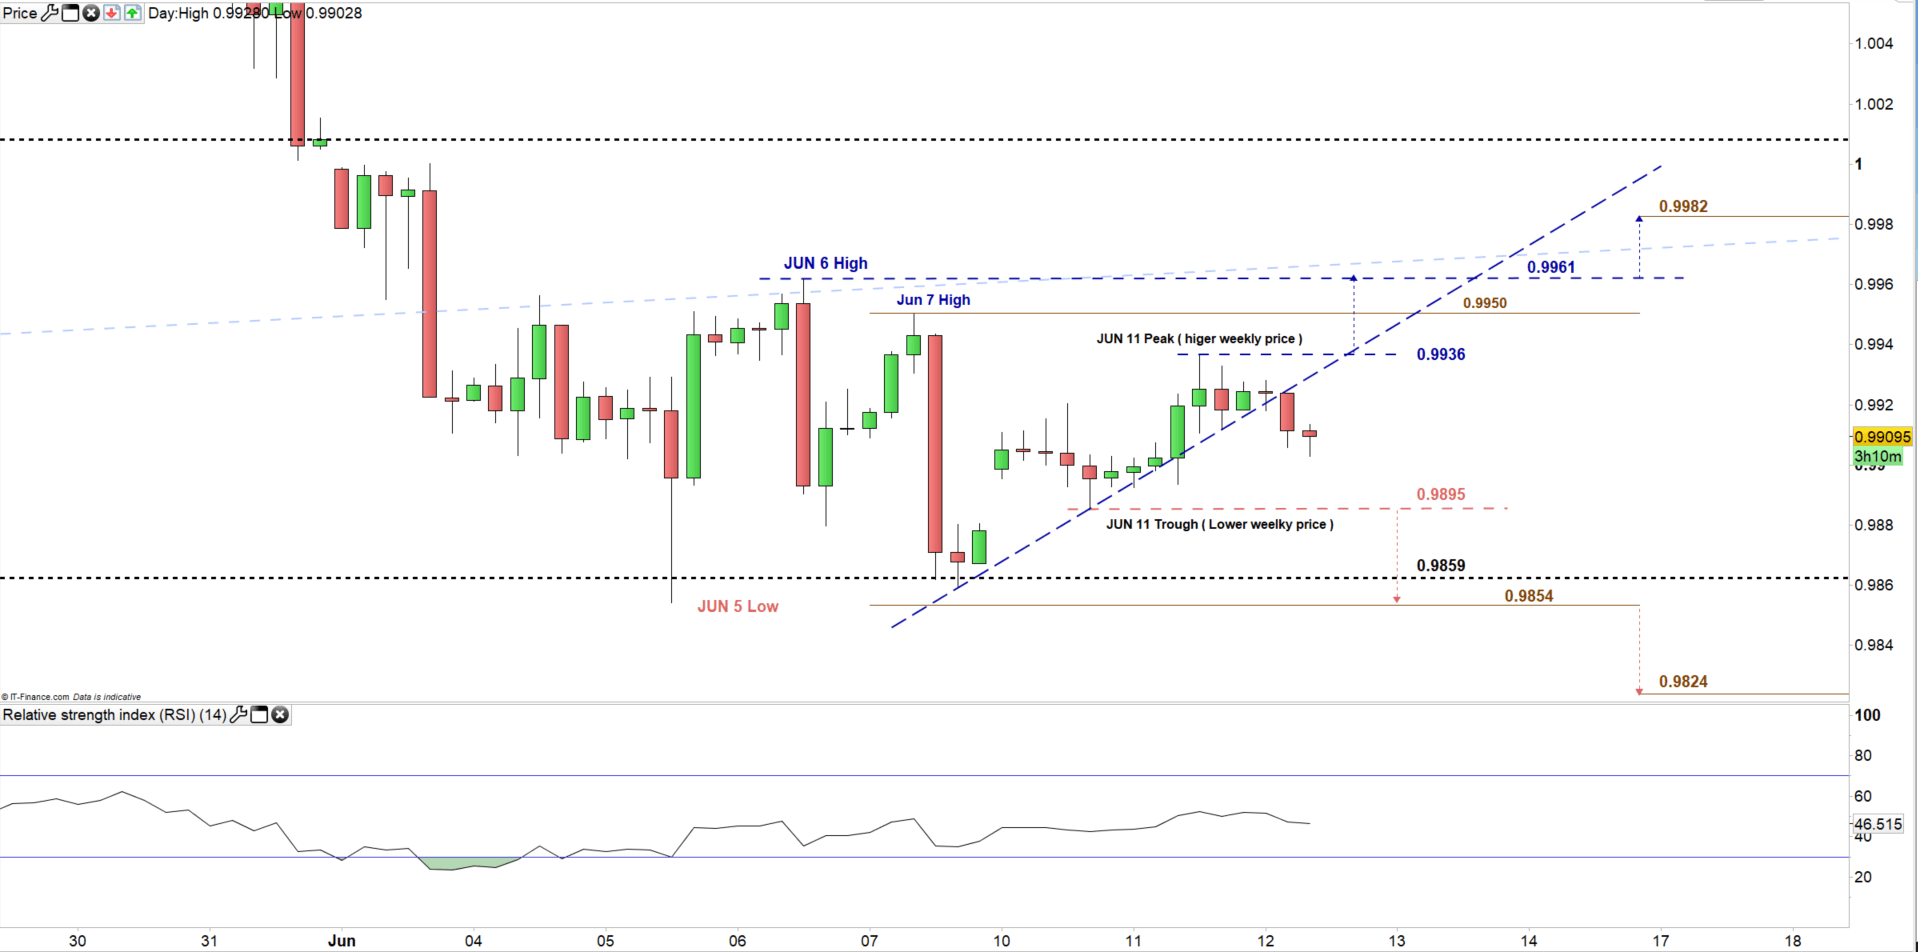
Looking at the four-hour Chart, we notice that today USD/CHF broke below the uptrend line originated from the Jun 7 low at 0.9859 reflecting the bears intention to send the price lower.
If the pair breaks below the June 11 trough (weekly low) at 0.9895 it might point towards the Jun 5 low at 0.9854 and towards 0.9824 after. Although, the support level at 0.9859 (the Jun 7 low) need to be kept in focus.
Any rally above the Jun 11 peak (weekly high) at 0.9936 could press towards 0.9961 and towards 0.9982 after. However, the resistance level at 0.9950 (the Jun 7 high) need to be considered.
Written By: Mahmoud Alkudsi
Please feel free to contact me on Twitter: @Malkudsi


