


To receive James Stanley’s Analysis directly via email, please sign up here.
Talking Points:
- USD/CHF Technical Strategy: Intermediate-term up-trend still alive; near-term bearish.
- The bullish price action previously showing in USD/CHF has waned as prices are now testing deeper support levels.
- If you’re looking for trading ideas, check out our Trading Guides. They’re free and updated for Q1, 2017. If you’re looking for ideas more short-term in nature, please check out our Speculative Sentiment Index Indicator (SSI).
In our last article, we looked at the congested move-lower in USD/CHF as the prior up-trend continued to retrace. And while the move-lower has persisted now for over six weeks after resistance came-in after new six-year highs, the bulk of the trend remains in-tact and this can keep the door open for top-side strategies.
Of particular interest to bulls is the zone of potential support running from .9947 up to the vaulted ‘parity’ figure at 1.0000. This 53-pip zone of support has numerous reasons to elicit interest: This had helped to form the resistance of the prior range that lasted for much of 2016. At .9951 we have the 61.8% Fibonacci retracement from the major move in the pair spanning the 2010 high down to the 2011 low. And at .9947 we have the 50% retracement of the ‘post-Election’ move in USD/CHF, which can help to demarcate bullish continuation prospects. Should price action fall below this zone, bullish continuation can be thought of as less-likely, so this can become an opportune zone to place stops or manage risk on bullish positions. On the Daily chart below, we’re looking at the current setup in Swissy with emphasis on this potential zone of support.
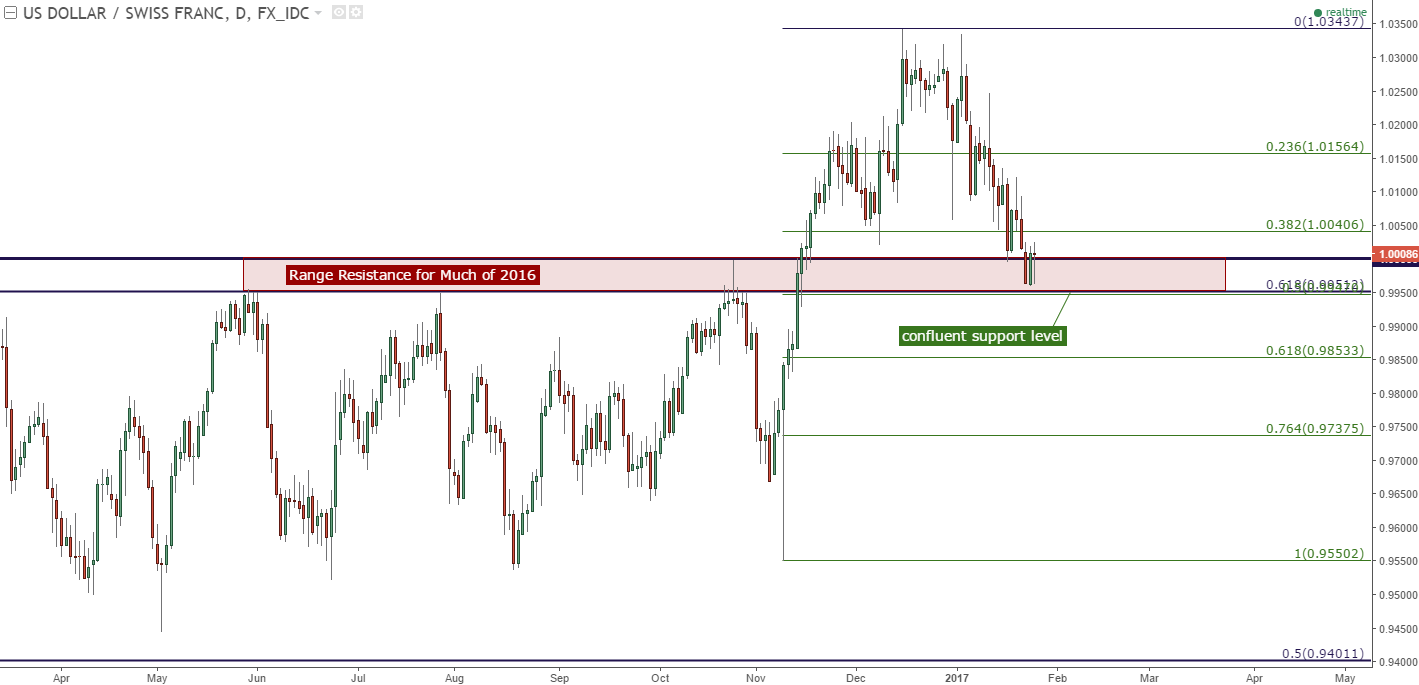
Chart prepared by James Stanley
On the shorter-term chart below, we can see buyers attempting to defend this confluent level above .9950, and the multiple wicks showing very near this level of support highlights multiple attempts from bears to drive below; each which was rebuked by buyers. Just a day later bears attempted to re-drive below support, but this time bulls showed up even-quicker, leading to the short-term higher-low shown on the chart below:

Chart prepared by James Stanley
For those that want to wait for confirmation or move-forward with a more-conservative stance, awaiting another ‘higher-high’ can highlight a greater indication that bulls may be able to take control of near-term price action. The prior swing-high came in at 1.0025, and a break-above this level will give us a fresh higher-high on the hourly chart to go along with that recent higher-low, signaling bullish continuation prospects on the near-term setup.
--- Written by James Stanley, Analyst for DailyFX.com
To receive James Stanley’s analysis directly via email, please SIGN UP HERE
Contact and follow James on Twitter: @JStanleyFX


