


To receive James Stanley’s Analysis directly via email, please sign up here.
Talking Points:
- USD/CHF Technical Strategy: Swissy ran to fresh six-year highs after the FOMC rate hike in December; but has since been unable to break above despite multiple attempts. .
- Price action has now made four attempts to break above this resistance around 1.0310, but sellers have continually thwarted price action’s attempt to set a higher-high.
- If you’re looking for trading ideas, check out our Trading Guides.
In our last article, we looked at the top-side breakout in USD/CHF just after the Federal Reserve’s December rate hike. Shortly after the Fed hiked rates for only the second time in the past ten years, USD/CHF ran-up to barely set a fresh six-year high. The prior-high at 1.0328 was taken out by 15 pips when December’s rally in the pair set a new-high at 1.0343. But as we wrote in our last USD/CHF piece, the fact that bulls weren’t able to respond with a deeper drive beyond resistance made the prospect of bullish continuation, at least at the time, seem like a distant prospect.
Since then we’ve seen three additional attempts to take out resistance with each being met by an influx of new sellers. This further strengthens the case for this ‘zone’ of resistance to be setting a near-term top in the pair, and traders will likely want to try to plan around this resistance zone for any Swissy-related strategies in the immediate future.
The level around 1.0300 is particularly interesting in USD/CHF, as not only has this helped to form resistance over the past month, but this is also the 61.8% retracement of the 2008-2011 major move in the pair. Traders looking to execute bullish positions will likely want to try to take profits ahead of this zone of resistance, while those lining up shorts would likely want to get stops set outside of this resistance zone.
As price action is catching near-term support off of the same re-entry level of 1.0176 that we had looked at in our last article, the near-term bias would still be bullish and classified as such until, at the very least we see a break below 1.0050, which had helped to set swing-support just before the close of 2016 trading.
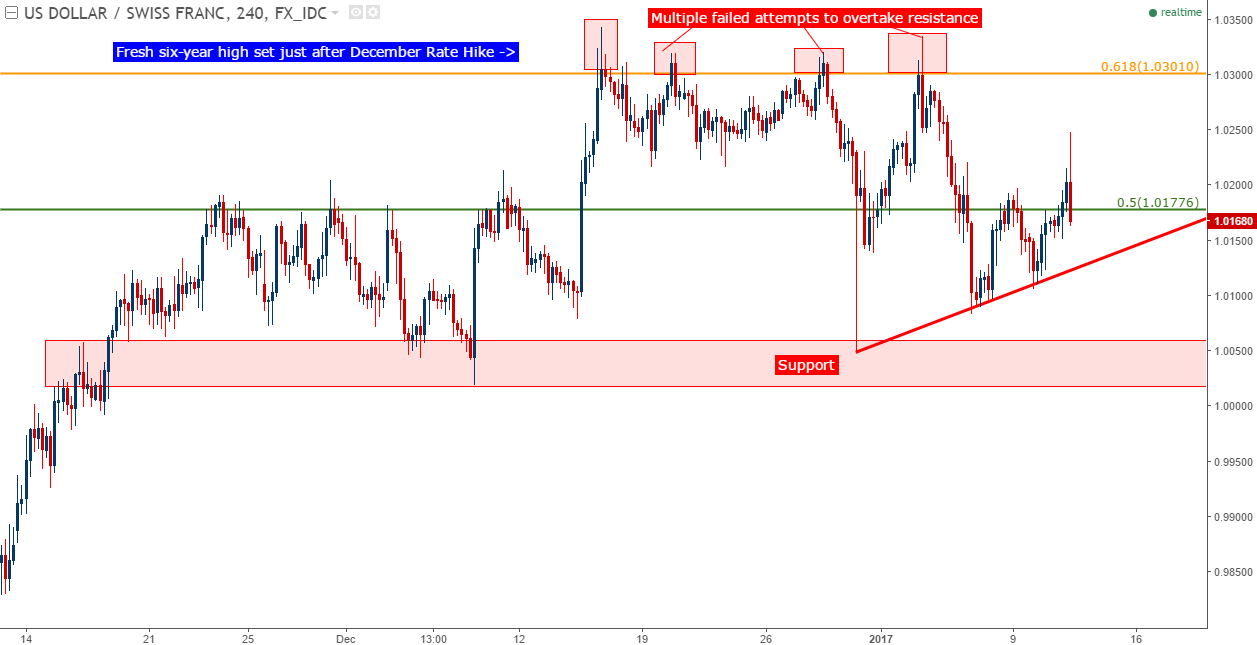
Chart prepared by James Stanley
--- Written by James Stanley, Analyst for DailyFX.com
To receive James Stanley’s analysis directly via email, please SIGN UP HERE
Contact and follow James on Twitter: @JStanleyFX


