


To receive James Stanley’s Analysis directly via email, please sign up here.
Talking Points:
- USD/CHF Technical Strategy: Swissy finally found the strength to break above prior resistance at 1.0176 after last week’s FOMC announcement.
- The Fed-induced top-side breakout sent USD/CHF up to fresh six-year highs; but resistance showed-up shortly thereafter and price action has been unable to break above this level on subsequent attempts.
- If you’re looking for trading ideas, check out our Trading Guides.
In our last article, we looked at the continued struggle in USD/CHF as the pair battled with resistance at the 1.0176-level. This is the 50% Fibonacci retracement of the major move in USD/CHF spanning from the top in 2005 to the lows of 2011; and when re-approaching this level on November 23rd, the momentum in USD/CHF was relatively strong. But as buyers continued to push price action up to resistance, sellers continued to show-up; and it wasn’t until three weeks later around the Federal Reserve’s December rate hike that the pair finally found the gumption to break-above.
When the Fed hiked rates while making hawkish adjustments for the next few years, USD-strength became a pervasive theme. This finally sent the Swissy above this resistance at 1.0176, with price action running-up to test the six-year high in the pair at 1.0328. And while we did technically make a new-high with price action running-up to 1.0344; sellers showed-up fairly quickly to reverse turn that top-side breakout into false-breakout.
This puts USD/CHF in an uncomfortable position. Yes – the trend is still bullish; but with so much respect of longer-term resistance and so many reactions over the past month, traders would likely want to take notice of the increased activity of sellers while we’re trading above the parity-figure. For those looking to voice long-USD continuation trades, there are likely better markets to do it (like USD/JPY); and probably better times to look to do so (not around holidays, year-end flows).
On the flip-side, for those looking for short-USD exposure – they’re taking the risk of fading a really aggressive trend that, at least at this point, has shown little sign of slowing down. Combine this with the fact that Swissy did technically make a higher-high after that Fed-induced breakout, and there are simply not enough signs to indicate reversal to yet make this a work-able idea.
For traders looking at bullish USD/CHF setups, support showing at the prior zone of resistance around 1.0175 could be interesting. To take a less-aggressive stance on the pair, support could be sought-out at the zone from parity-to-1.0050. Either of these levels could allow for the establishment of a longer-term ‘higher-low’ in the effort of trading top-side continuation strategies.
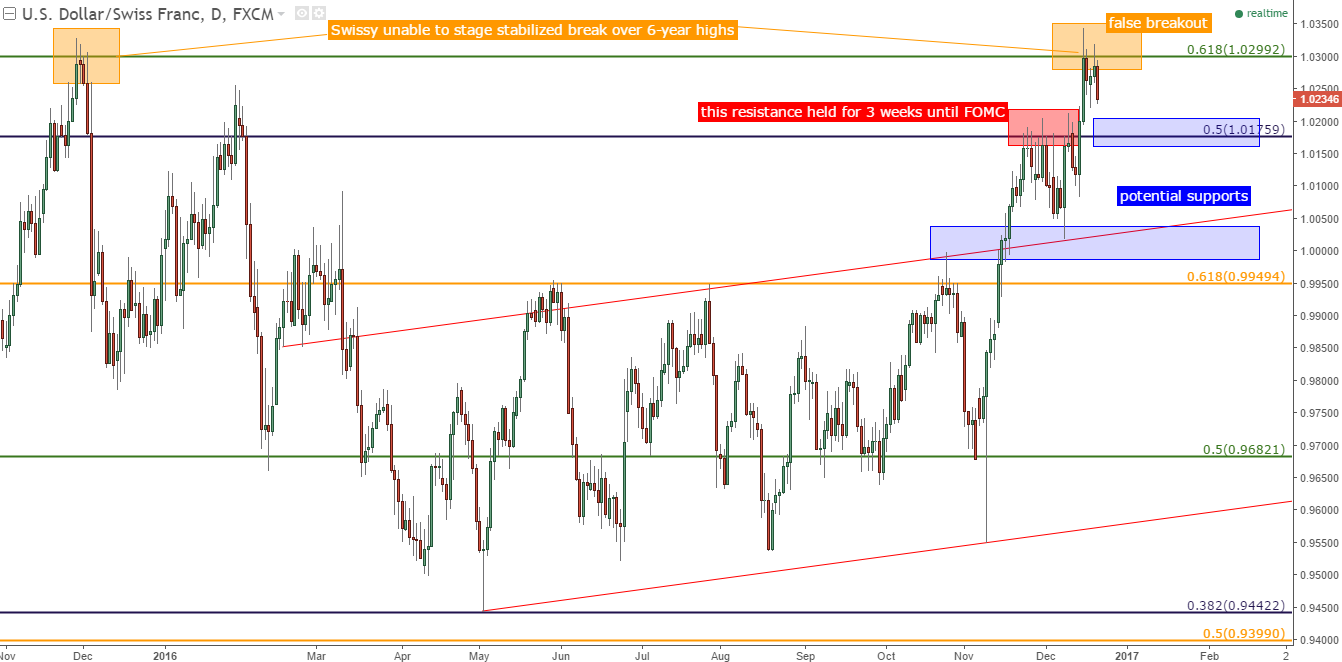
Chart prepared by James Stanley
--- Written by James Stanley, Analyst for DailyFX.com
To receive James Stanley’s analysis directly via email, please SIGN UP HERE
Contact and follow James on Twitter: @JStanleyFX


