


To receive James Stanley’s Analysis directly via email, please sign up here.
Talking Points:
- USD/CHF Technical Strategy: Bullish near-term price action structure continues to build.
- As the US Dollar continues to trade within a range, CHF may remain as an attractive candidate to voice long-USD themes.
- SSI - If you’re looking for trading ideas, check out our Trading Guides. And if you want something more short-term in nature, check out our SSI indicator.
In our last article, we looked at the bullish price action structure that’s continued to build in USD/CHF. And given the fact that the Swiss National Bank had already shown some sensitivity to a strong Franc, denoted by the intervention that they’d admitted to in the post-Brexit price action environment, this could make USD/CHF an attractive candidate for voicing long-USD themes.
Coupling with that idea is price action structure in USD/CHF since the Brexit referendum. After a strong top-side pop, USD/CHF has continued to build a bullish price action structure with higher-highs and higher-lows. We took a long position in Swissy two weeks ago and have had one profit target hit; and another top-side entry may not be too far around-the-corner.
But longer-term there is a valid reason for moderating that stance from becoming too bullish. Over the past six years Swissy has seen compressing price action building into a symmetrical wedge formation. And while this may eventually break, especially if we see a significant change in Central Bank policy or stance from either representative economy, traders would likely want to factor this formation-in with near-term price action. On the chart below, we look at that wedge, and notice that the top-side of that wedge currently projects to approximately ~1.0130.
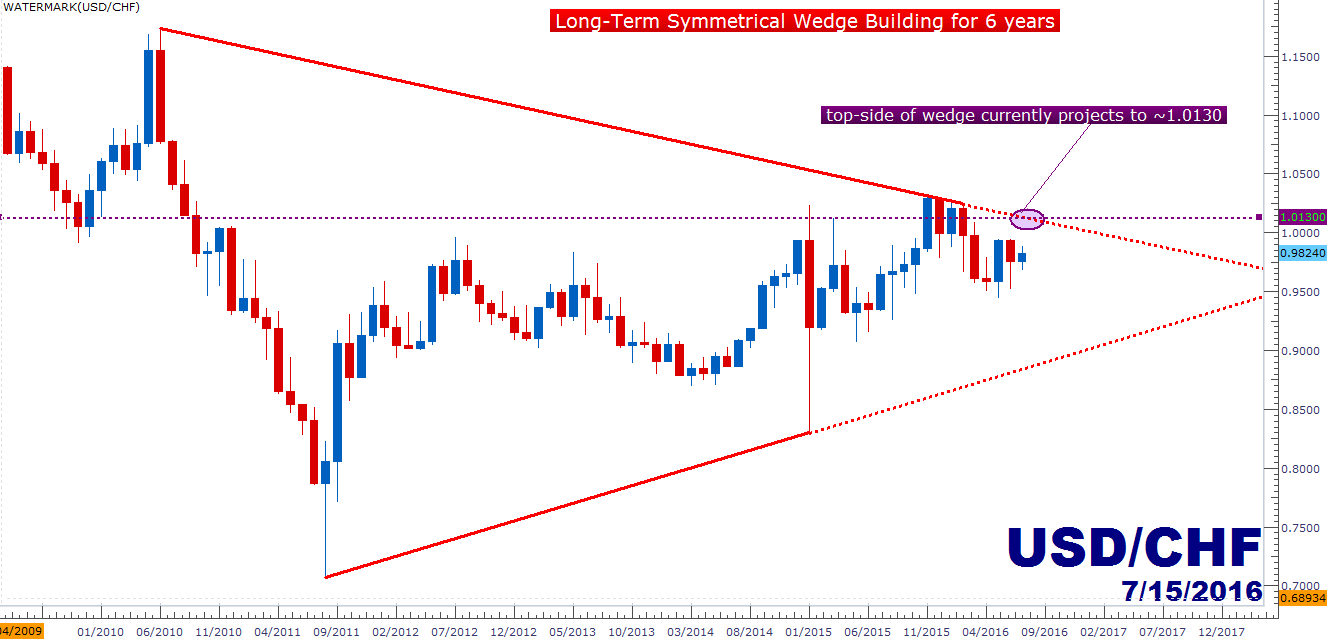
Created with Marketscope/Trading Station II; prepared by James Stanley
This level of 1.0130 is interesting from a few different vantage points, as this is also the 23.6% Fibonacci retracement of the major move in the pair, taking the May 2015 low up to the November high. And just a couple pips below, we have the 38.2% Fibonacci retracement of the prior major move. So this can become a usable level in top-side approaches, as traders can incorporate this as a final profit target on the long stance.
On the hourly chart below, we investigate the near-term structure in USD/CHF with a channel applied to the post-Brexit price action seen in the pair. We’ve just moved off of the support-side of the channel, and the prior swing low in the vicinity of the .9750 major psychological level can be used as a basis for stop placement.
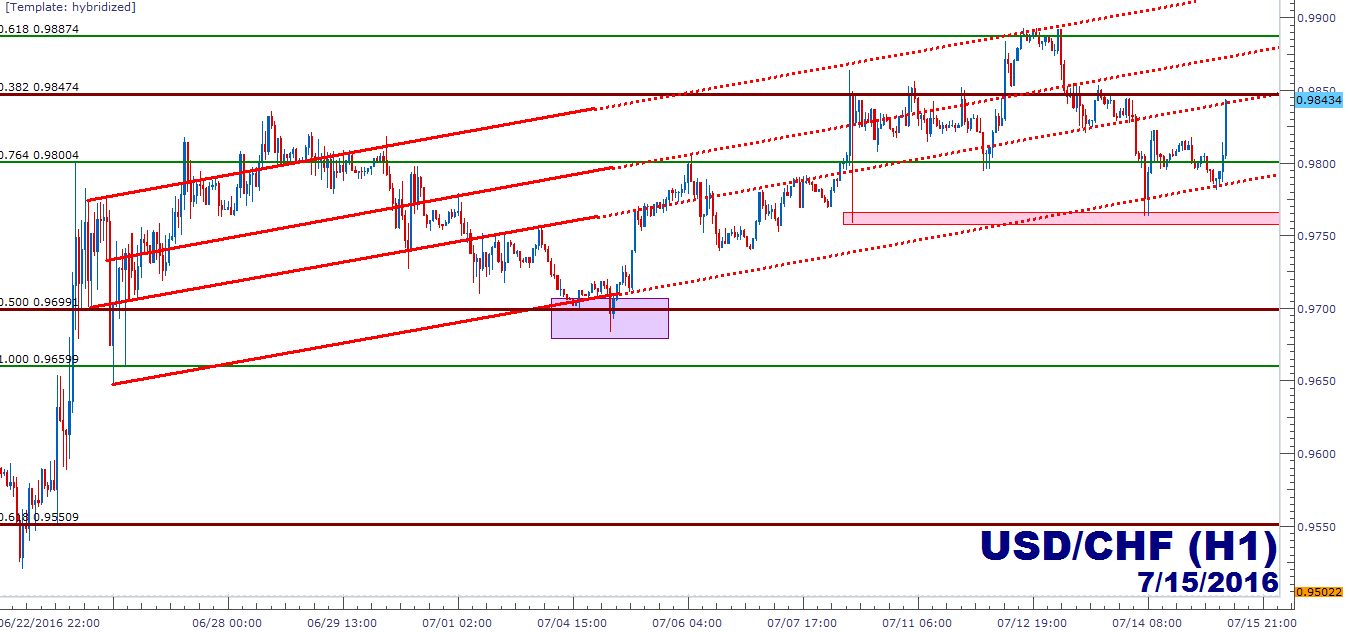
Created with Marketscope/Trading Station II; prepared by James Stanley
--- Written by James Stanley, Analyst for DailyFX.com
To receive James Stanley’s analysis directly via email, please SIGN UP HERE
Contact and follow James on Twitter: @JStanleyFX


