


USD/CAD Technical Outlook
- USD/CAD found resistance to be too much to break on through
- Strong short-term bearish momentum has more downside in focus

USD/CAD Technical Outlook: More Downside Likely
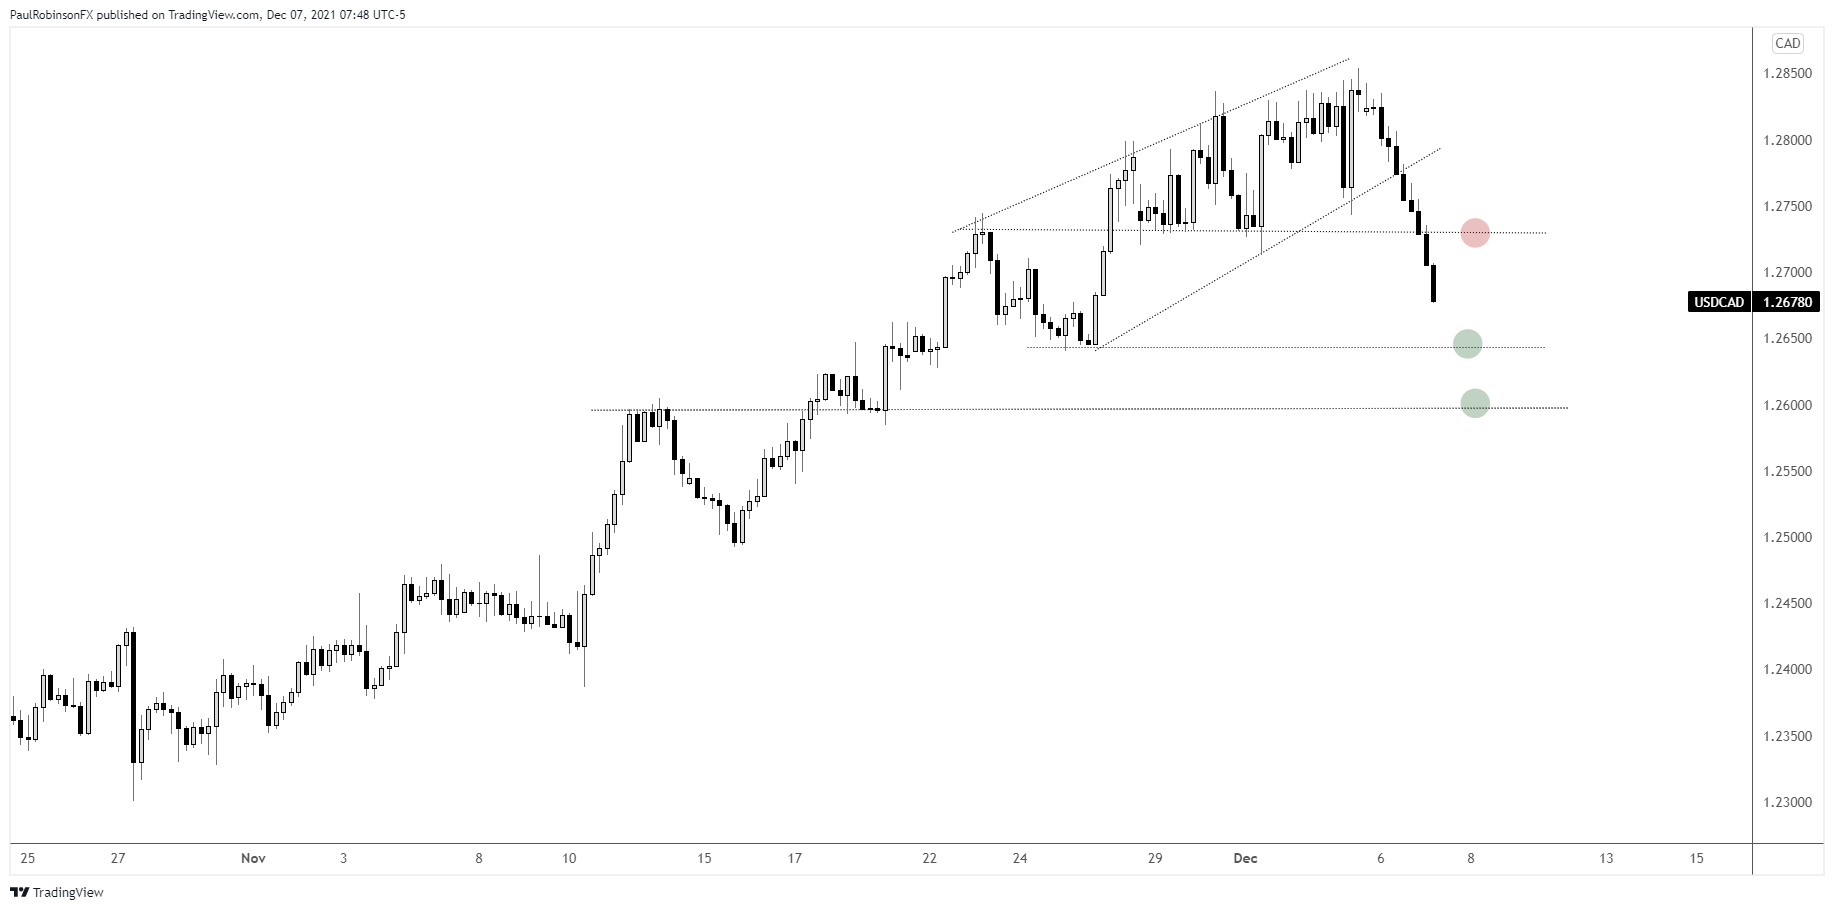
As USD/CAD kept trying to push through the area just over 12800, it was a bit of a struggle trying to figure out what would happen next. The thinking was a strong break through resistance in the low 12800s would get USD/CAD in gear towards the 12950 level.
And while it held for a few days and had the look of a pair that was poised to trade higher, there was never any real convincing break through resistance. The repeated failures to trade higher first set up a rising wedge (no longer visible) when then became a grinding upward channel that if broken suggested a sharp move could unfold. As we are seeing now.
The breakdown has been relatively fierce, at least in this environment where big FX moves are hard to come by. The momentum suggests that there will be residual selling in the near-term even if the past couple of days proves to be the majority of weakness.
With that in mind, the path of least resistance is viewed as being down with the next level of support arriving at a minor point at 12640 followed by 12600. Neither are big levels, but ones that could stall selling for a short while. How far down USD/CAD could drop is difficult to say, but if recent history is any guide then it could be a bit further before we see a meaningful low develop.
Over the summer into the fall there were three peaks that formed in the same vicinity as last week’s, and each led to sell-offs that were at least twice the size of what we have seen the past couple of days.
Tactically speaking, existing shorts may want to sit tight and wait for signs of a bottom forming before looking to take profits or exit. Would-be shorts may want to be patient and wait for a near-term bounce (perhaps to the 12730 area) or continuation pattern. Longs hold no appeal at this time.
USD/CAD Daily Chart

USD/CAD 4-hr Chart
Resources for Forex Traders
Whether you are a new or experienced trader, we have several resources available to help you; indicator for tracking trader sentiment, quarterly trading forecasts, analytical and educational webinars held daily, trading guides to help you improve trading performance, and one specifically for those who are new to forex.
---Written by Paul Robinson, Market Analyst
You can follow Paul on Twitter at @PaulRobinsonFX


