


USD/CAD Technical Outlook
- USD/CAD bounced off support, but looks only corrective in nature
- Short-term charts suggest we will soon see price turn down
- A break of month-long support is seen as likely

USD/CAD Technical Outlook: Short-term Chart in Focus
USD/CAD has bounced the past couple of days, but renewed weakness is expected to set in again here shortly. The reversal from around the middle of July has set off an orderly trend that is now showing classic corrective price behavior on the 1 to 4hr time-frames.
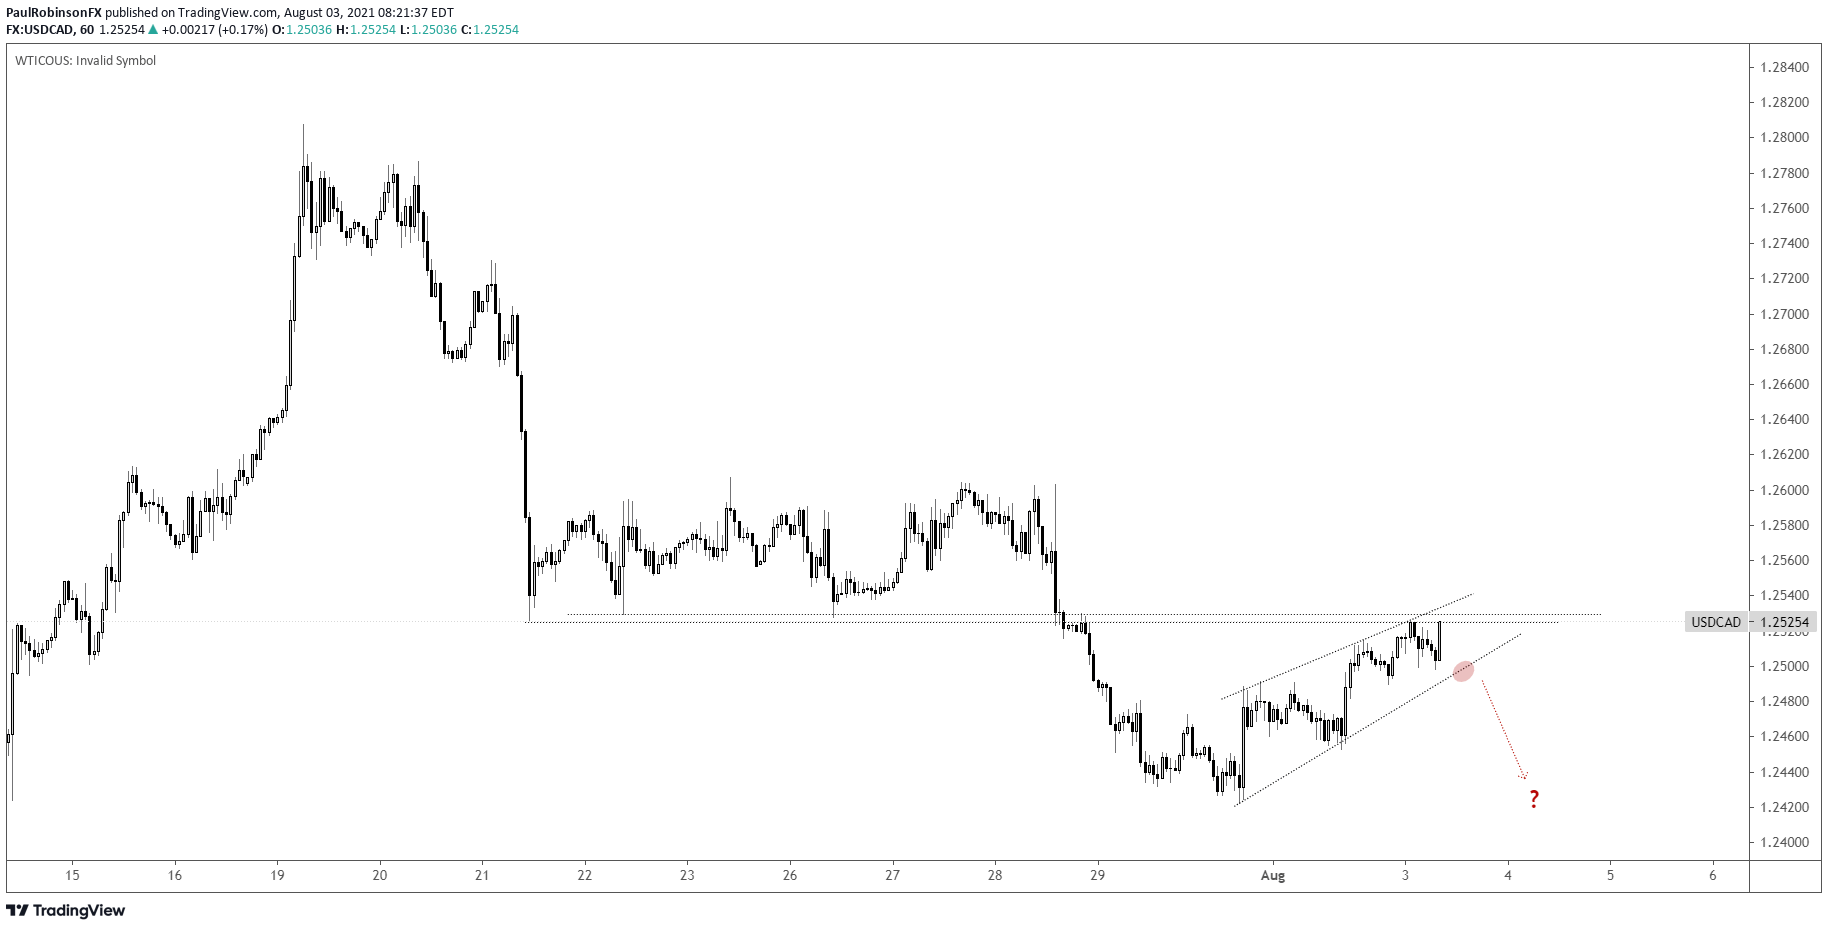
The hourly shows it most clearly, with a corrective wedge forming. These patterns consist of a narrowing range and overlapping price action, which is indicative of a market that is unable to reverse the most recent decline.
Not only is the pattern nearing completion, but price is very near resistance that formed during the last run of horizontal price action. The area around 12525 is seen as likely to keep a lid on any further strength from here.
To confirm the corrective pattern there needs to be a breaking of the lower trend-line of the pattern. These formations aren’t perfect of course, so waiting for confirmation is key. USD/CAD could still attract buying interest and break higher above resistance.
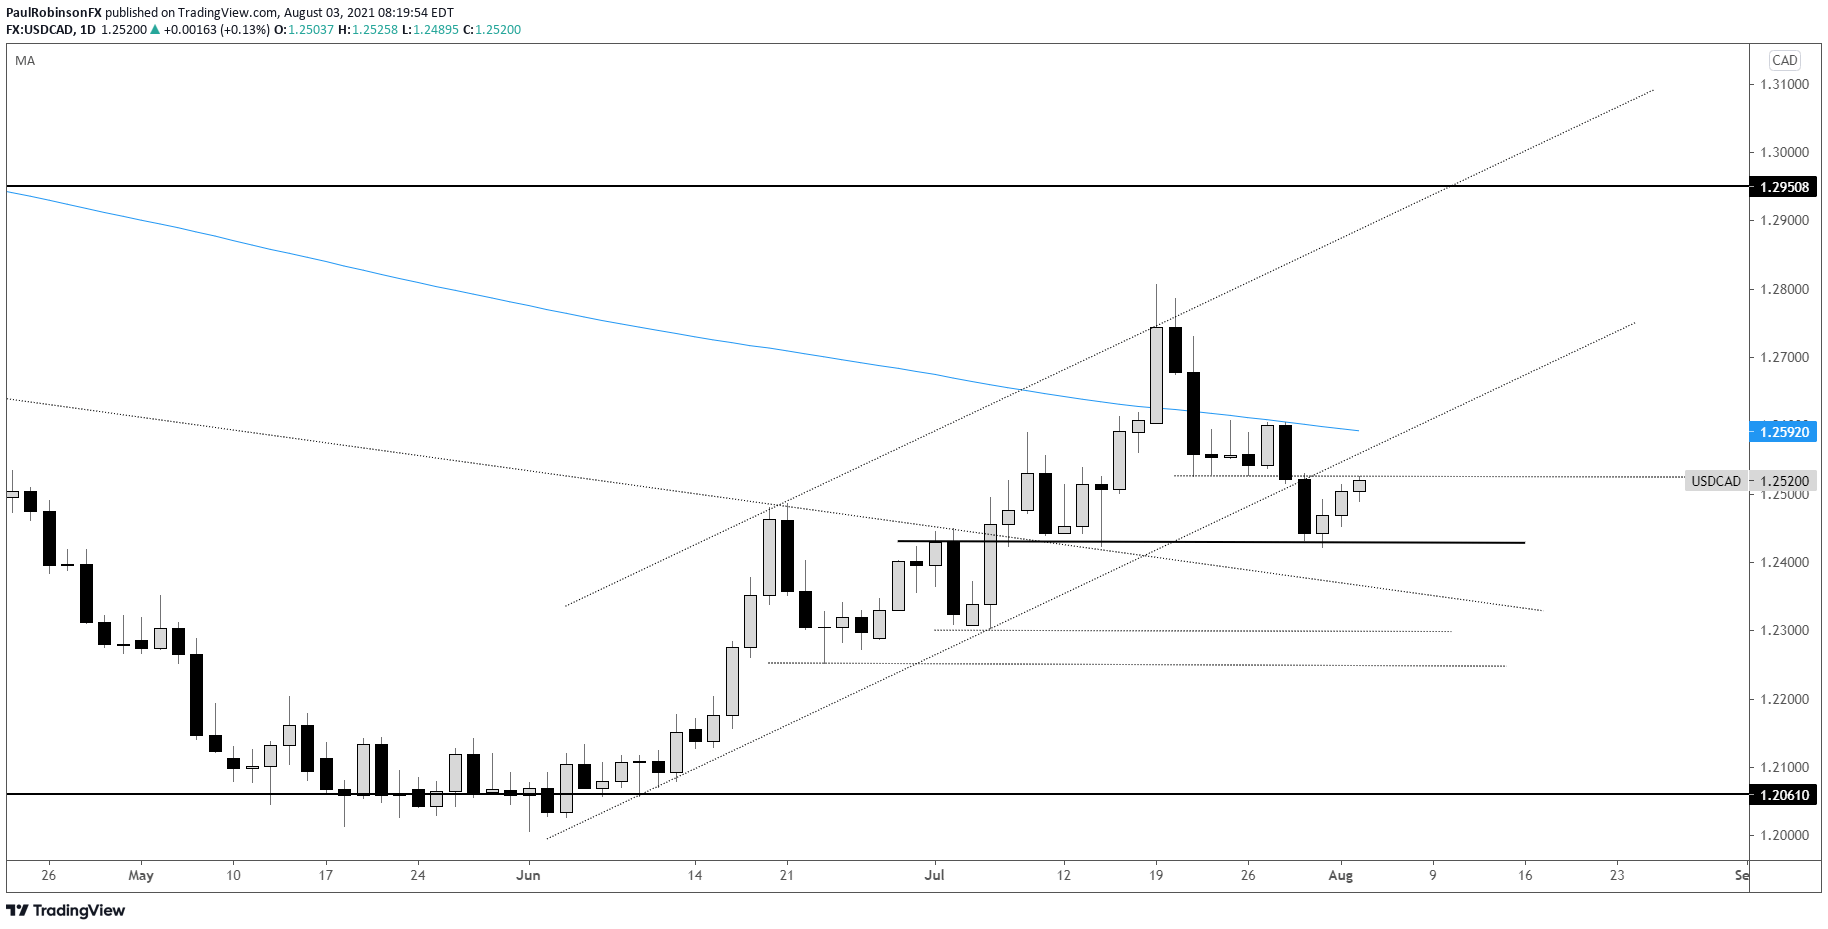
Should the pattern trigger, looking for price to decline below 12422, which would also be a breach of an area of support that has been growing with importance over the past month. The 12450/12422-area first acted as resistance at the start of July, but has since turned into a meaningful level of support.
A break below support would then have the next region of support in focus from just over 12300 down to 12252. There is a slope from December to watch prior to those levels, but given it is running with the direction of the trend it isn’t viewed as the most meaningful level.
On the flip-side, should we see the wedge fail to confirm and price rise strongly above 12525, then the outlook neutralizes a bit. But it will still take some work to turn the picture bullish. At this juncture it would take a strong push higher and holding of strength to start building a generally bullish bias.
USD/CAD Daily Chart
USD/CAD Hourly Chart
Resources for Forex Traders
Whether you are a new or experienced trader, we have several resources available to help you; indicator for tracking trader sentiment, quarterly trading forecasts, analytical and educational webinars held daily, trading guides to help you improve trading performance, and one specifically for those who are new to forex.
---Written by Paul Robinson, Market Analyst
You can follow Paul on Twitter at @PaulRobinsonFX


