


Canadian Dollar Technical Price Outlook: Near-term Trade Levels
- Canadian Dollar updated technical trade levels – Daily & Intraday Charts
- USD/CAD Post-FOMC rebound shifts near-term focus higher
- Support 1.3323 - Key resistance zone back at 1.3602/47
The US Dollar plummeted more than 9% from the March highs against the Canadian Dollar with USD/CAD responding to Fibonacci support this week on the heels of the FOMC interest rate decision. Although the broader risk remains lower, the post-Fed rally has cleared the weekly opening-range highs and threatens a larger recovery near-term. These are the updated targets and invalidation levels that matter on the USD/CAD price charts heading into the close of the week. Review my latest Weekly Strategy Webinar for an in-depth breakdown of this Loonie trade setup and more.
Canadian Dollar Price Chart – USD/CAD Daily

Chart Prepared by Michael Boutros, Technical Strategist; USD/CAD on Tradingview
Technical Outlook: In my last Canadian Dollar Price Outlook we noted that USD/CAD was, “testing a critical support zone at 1.3602/10 – a region defined by the 61.8% Fibonacci retracement of the yearly range and the 100% extension of the decline off the March high…with a break / close below needed to keep the short-bias viable with subsequent support objectives at the Mary 2019 high-day close at 1.3515 and the March / 2017 opens at 1.3433/35.”
Price broke key support into the open of June trade with the decline taking out both support objectives before rebounding off the 78.6% Fibonacci retracement yesterday at 1.3323. The rally threatens a larger recovery with key resistance now back at 1.3602/10 – broader bearish invalidation now lowered to the 2017 HDC at 1.3647- both areas of interest for possible topside exhaustion IF reached.
Canadian Dollar Price Chart – USD/CAD 120min

Notes: A closer look at Loonie price action shows USD/CAD trading within the confines of a near-term descending pitchfork formation with price now approaching initial resistance at the Mary 2019 high-day close at 1.3515. Initial support now rests with the 2017 open at 1.3435 with a break / close below 1.3323 needed to mark resumption towards 1.3221 and the lower parallels.

Bottom line: The Canadian Dollar rally has taken USD/CAD into Fibonacci support and the focus is on this near-term recovery in price. Look for downside exhaustion head of the weekly open IF price is indeed heading higher on this stretch – ultimately, the risk remains lower while within this formation. Review my latest Canadian Dollar Weekly Price Outlook for a closer look at the longer-term USD/CAD technical trade levels.
For a complete breakdown of Michael’s trading strategy, review his Foundations of Technical Analysis series on Building a Trading Strategy
Canadian Dollar Trader Sentiment – USD/CAD Price Chart
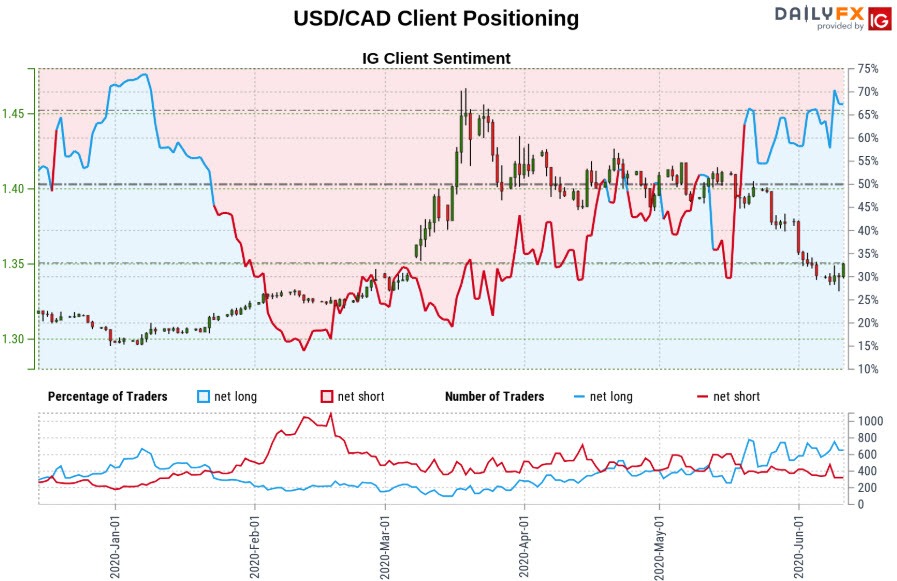
- A summary of IG Client Sentiment shows traders are net-long USD/CAD - the ratio stands at +2.04 (67.15% of traders are long) – bearish reading
- Long positions are11.38% lower than yesterday and 10.70% lower from last week
- Short positions are8.87% lower than yesterday and 12.85% lower from last week
- We typically take a contrarian view to crowd sentiment, and the fact traders are net-long suggests USD/CAD prices may continue to fall. Traders are less net-long than yesterday but more net-long from last week. The combination of current positioning and recent changes gives us a further mixed USD/CAD trading biasfrom a sentiment standpoint.
| Change in | Longs | Shorts | OI |
| Daily | -2% | 7% | 5% |
| Weekly | -30% | 38% | 13% |
---
Key US / Canada Data Releases
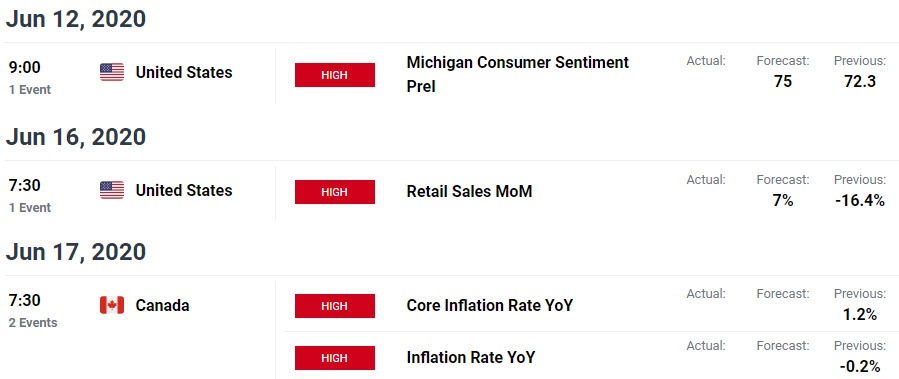
Economic Calendar - latest economic developments and upcoming event risk.
Active Trade Setups
- Gold Price Technical Outlook: XAU/USD Recovery Faces Trend Resistance
- Australian Dollar Price Outlook: Aussie Breakout Stalls at 2020 Open
- Dollar Price Outlook: USD Technical Breakdown at Yearly Open Support
- Yen Technical Price Outlook: USD/JPY Breakout Testing Trend Extremes
- Dollar vs Mexican Peso Technical Outlook: USD/MXN Breakdown Levels
- Written by Michael Boutros, Currency Strategist with DailyFX
Follow Michael on Twitter @MBForex


