


Canadian Dollar Price Forecast
- USD/CAD charts and analysis
- US Dollar price action against Canadian Dollar
Have you seen our newest trading guides for USD, EUR and Gold ? Download for free our latest forecasts
USD/CAD Price – Trendless Move
Last week, USD/CAD corrected lower creating a lower high at 1.3339. The pair failed this week for the second time to overtake 1.3346 capping any positive effort to lead the price higher.
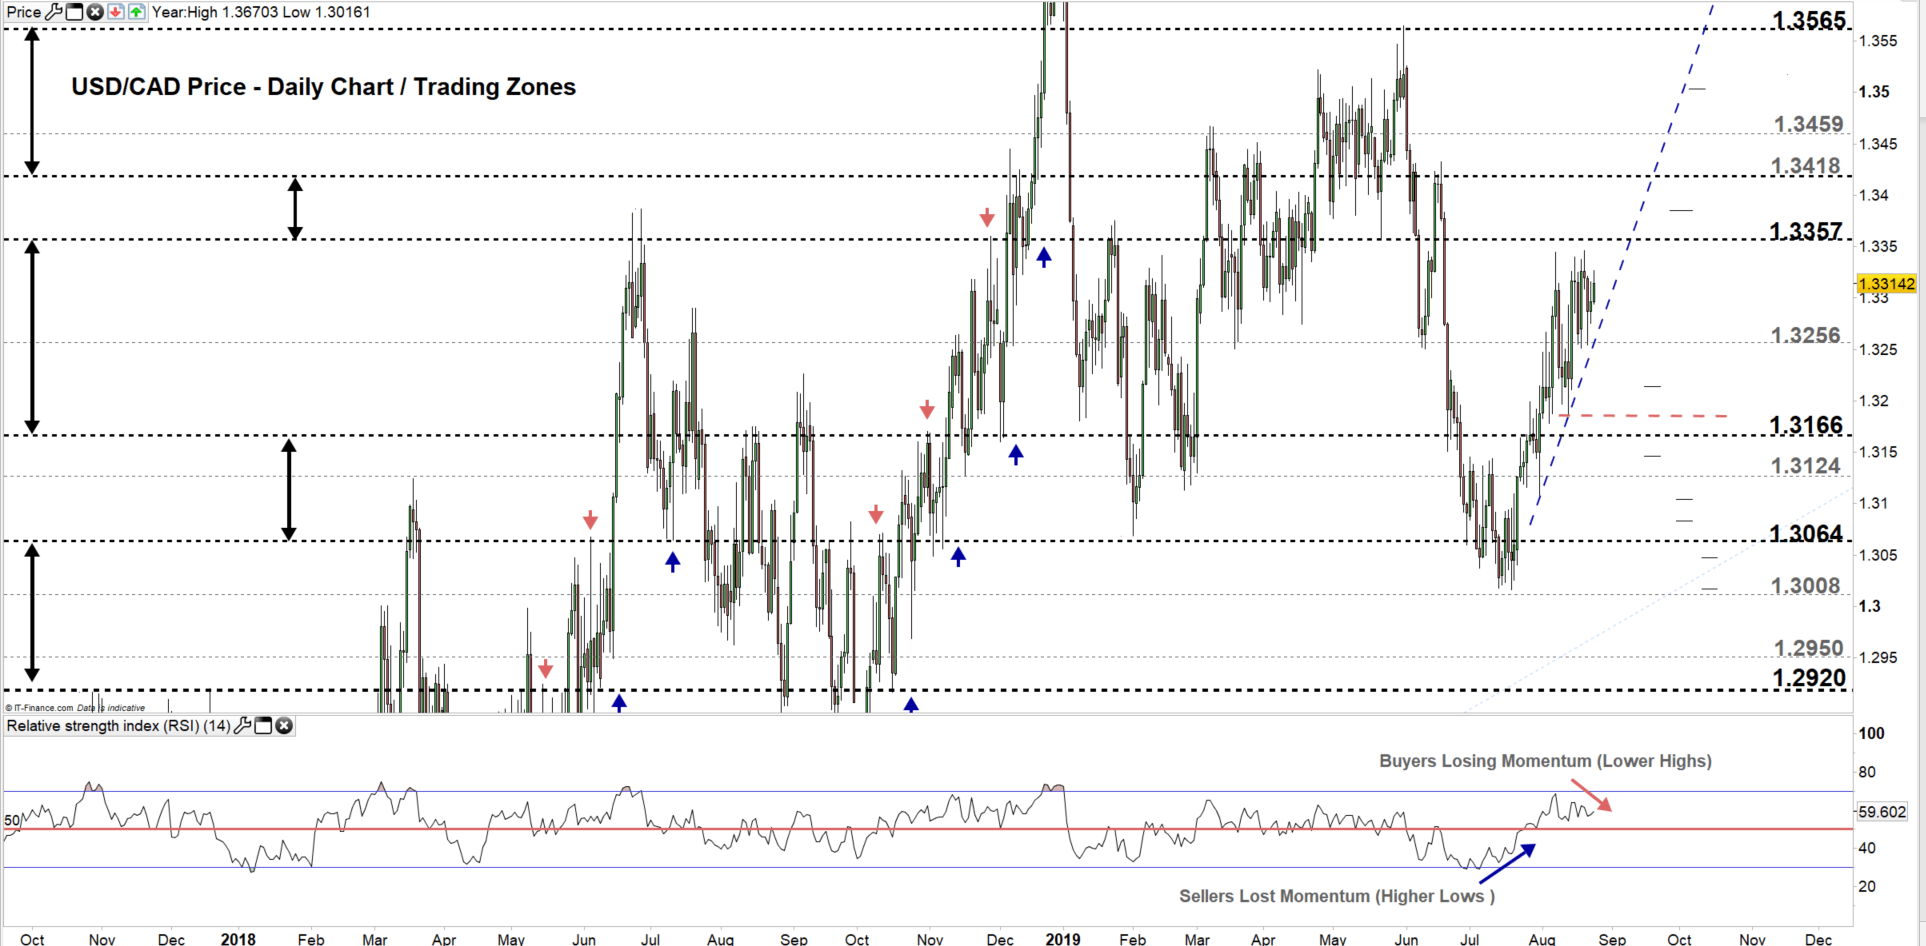
The Relative Strength Index (RSI) has been creating lower highs indicating to buyer’s loss of momentum. Although, the oscillator remained flat this week reflecting buyer’s attempt to stay in charge.
Just getting started? See our Beginners’ Guide for FX traders
USD/CAD DAILY PRICE CHART (Sep 10, 2017 – AUG 23, 2019) Zoomed Out
USD/CAD DAILY PRICE CHART (May 20 – AUG 23, 2019) Zoomed In
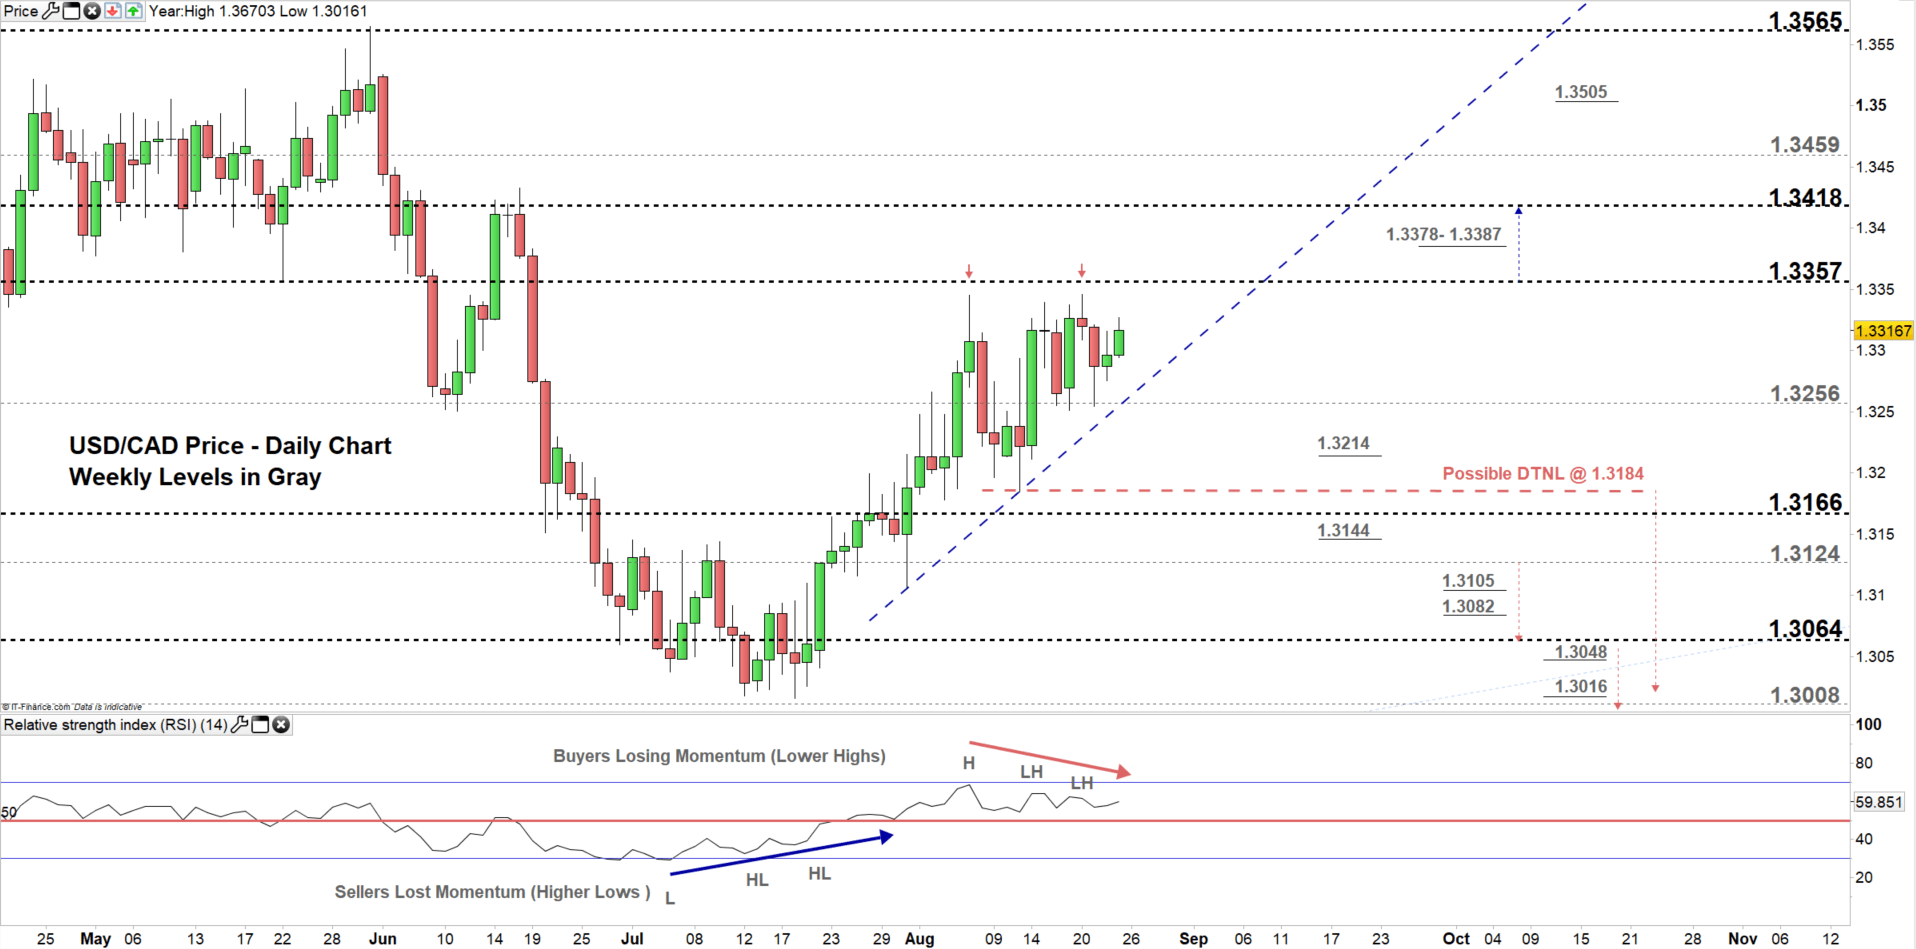
Looking at the daily chart, we notice since the end of last week USD/CAD remained in the trading zone 1.3256 – 1.3357.
Sellers failed in multiple occasions to force a close below the lower trading zone hence, any successful close below 1.3256 could send USDCAD towards 1.3166 nonetheless, the weekly support level underscored on the chart (zoomed in) with the neckline of a double top pattern discussed previously at 1.3184 should be kept in focus.
In turn, any close above the high end of the zone may cause a rally towards 1.3418. Although, the weekly resistance area marked on the chart would be worth monitoring. Further close above this level could see the price trading even higher towards 1.3459.
Having trouble with your trading strategy? Here’s the #1 Mistake That Traders Make
USD/CAD Four-HOUR PRICE CHART (AUG 1 – AUg 23, 2019)
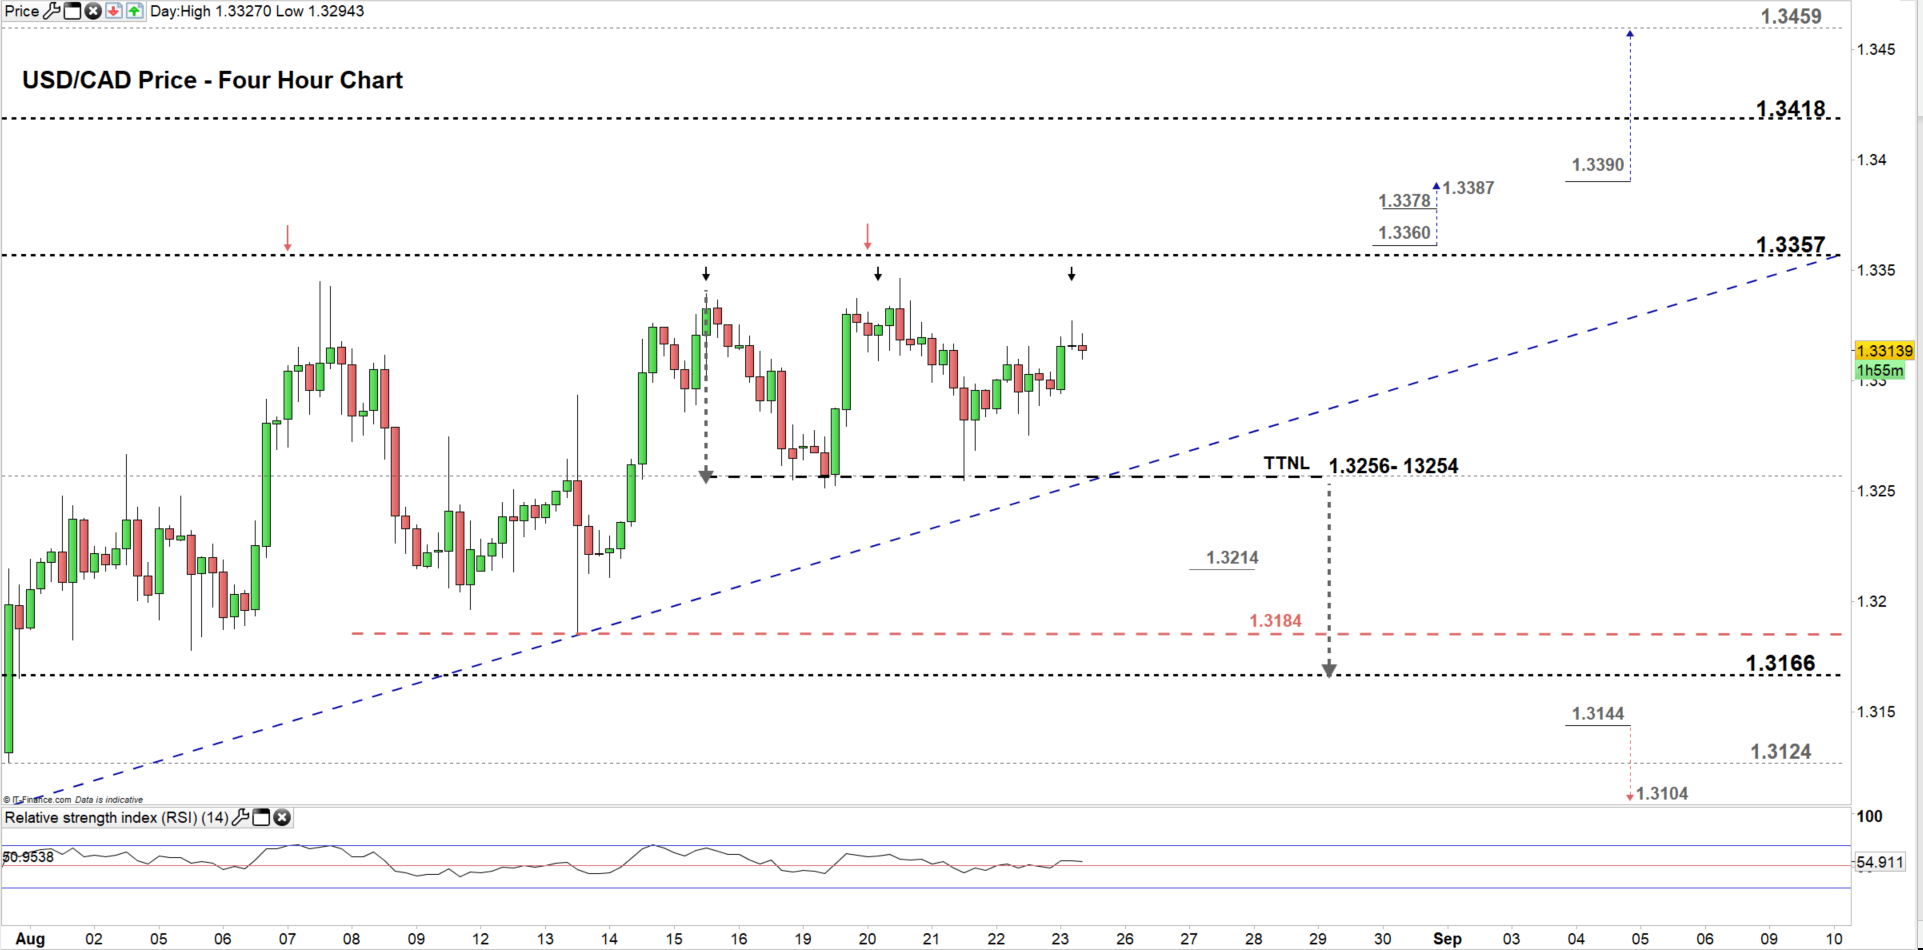
Looking at the four-hour chart, we notice on Wednesday USD/CAD rebounded for the second time around 1.3254 then rallied creating a possible reversal pattern (triple top formation).
Therefore, if USDCAD breaks and remains below 1.3254 the price may press towards 1.3166. Although, the weekly support level underlined on the chart should be considered. See the chart to find out more about the lower support levels sellers would face in a further bearish move.
On the flip- side, any rally above the high end of the aforementioned trading zone would negate the triple top pattern. Hence a break above 1.3360 could push USDCAD towards 1.3387 however, the weekly resistance level underlined on the chart should be monitored. See the chart to know more about the higher resistance levels buyers would encounter in a further bullish move.
Written By: Mahmoud Alkudsi
Please feel free to contact me on Twitter: @Malkudsi


