USD/CAD Price Outlook
Have you checked the Q3 USD and Gold forecasts download for free main currencies and commodities trading guides.
USD/CAD – Trendless Move
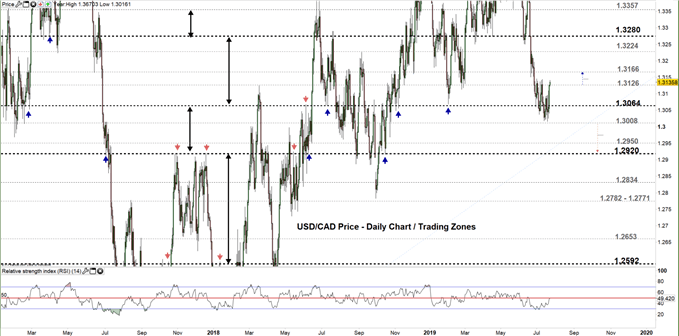
On Thursday USD/CAD tested it lowest levels in nearly nine months however, the price rallied after then closed with a Doji pattern, reflecting the market indecision at this stage. At the start of this week the price continued its ineffective move.
Yesterday, the Relative Strength Index (RSI) pointed higher then stopped before crossing 50 emphasizing exhausted sellers on one hand, and the lack of momentum form the buyers to kick start an uptrend move on the other.
Having trouble with your trading strategy? Here’s the #1 Mistake That Traders Make
USD/CAD DAILY PRICE CHART (April 15, 2017 – July 23, 2019) Zoomed Out

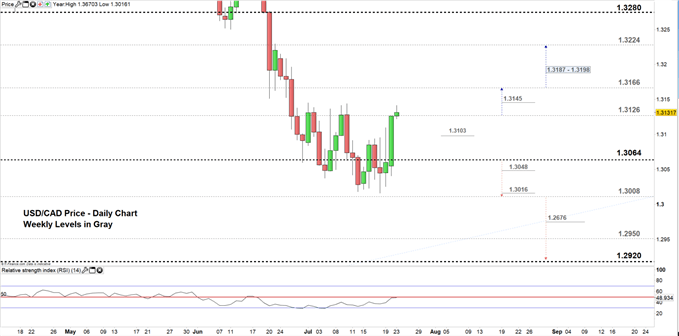
USD/CAD DAILY PRICE CHART (Arril 19 – JULy 23, 2019) Zoomed In

Looking at the daily chart we notice today USD/CAD has tested its higher level in nearly two weeks, and currently trading in the higher trading zone 1.3126 – 1.3166. Therefore, a close above the low-end of this zone could send the pair towards the high-end however, the weekly resistance at 1.3145 needs to be monitored.
Further bullish close above the high-end of the zone may push the price towards 1.3224 nonetheless, the weekly resistance area highlighted on the chart should be considered.
On the flip-side, any failure in closing above the low-end of the zone could press the price towards 1.3064 although, the weekly support at 1.3103 needs to be watched closely.
Just getting started? See our Beginners’ Guide for FX traders
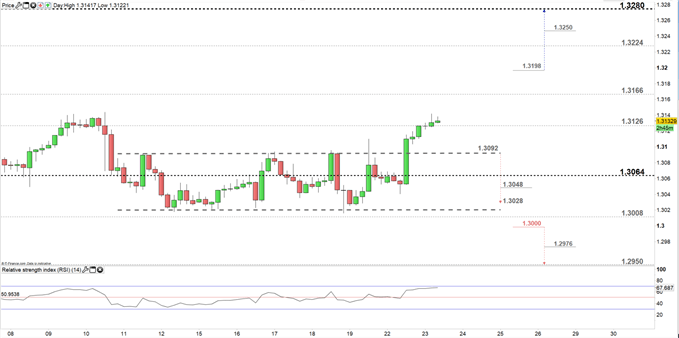
USD/CAD Four-HOUR PRICE CHART (JULY 5– JuLY 23, 2019)

Looking at the four-hour chart we notice on Monday USD/CAD rallied off the consolidation range (see the chart) eyeing a test of the high-end of the aforementioned trading zone. Therefore, a break above 1.3198 may cause a rally towards 1.3280 however, the weekly resistance levels marked on the chart should be watched along the way.
On the other hand, any return to the consolidation range may embolden the sellers to lead the price hence, a break below 1.3092 could send USD/CAD towards 1.3028 although, the weekly support levels underlined on the chart should be kept in focus.
Written By: Mahmoud Alkudsi
Please feel free to contact me on Twitter: @Malkudsi


