


USD/CAD Price Forecast
- Eyes on Fed Bullard’s speech for US Dollar with retail sales data release for Canadian Dollar today.
- USD/CAD price action.
Have you checked the Q3 USD and Gold forecasts download for free main currencies and commodities trading guides, and learn what is likely to drive the price action through this time of the year.
USD/CAD – Trading Ineffectively
This week USD/CAD buyers have been capped at 1.3092 showing no impulse to keep pushing the price higher. In turn, the bearish move also has been showing slow down signs leading the pair lower however ineffectively.
Alongside this, the Relative Strength Index (RSI) rose from 31 to 40 then remained flat after, negating any effective momentum from the buyers.
Having trouble with your trading strategy? Here’s the #1 Mistake That Traders Make
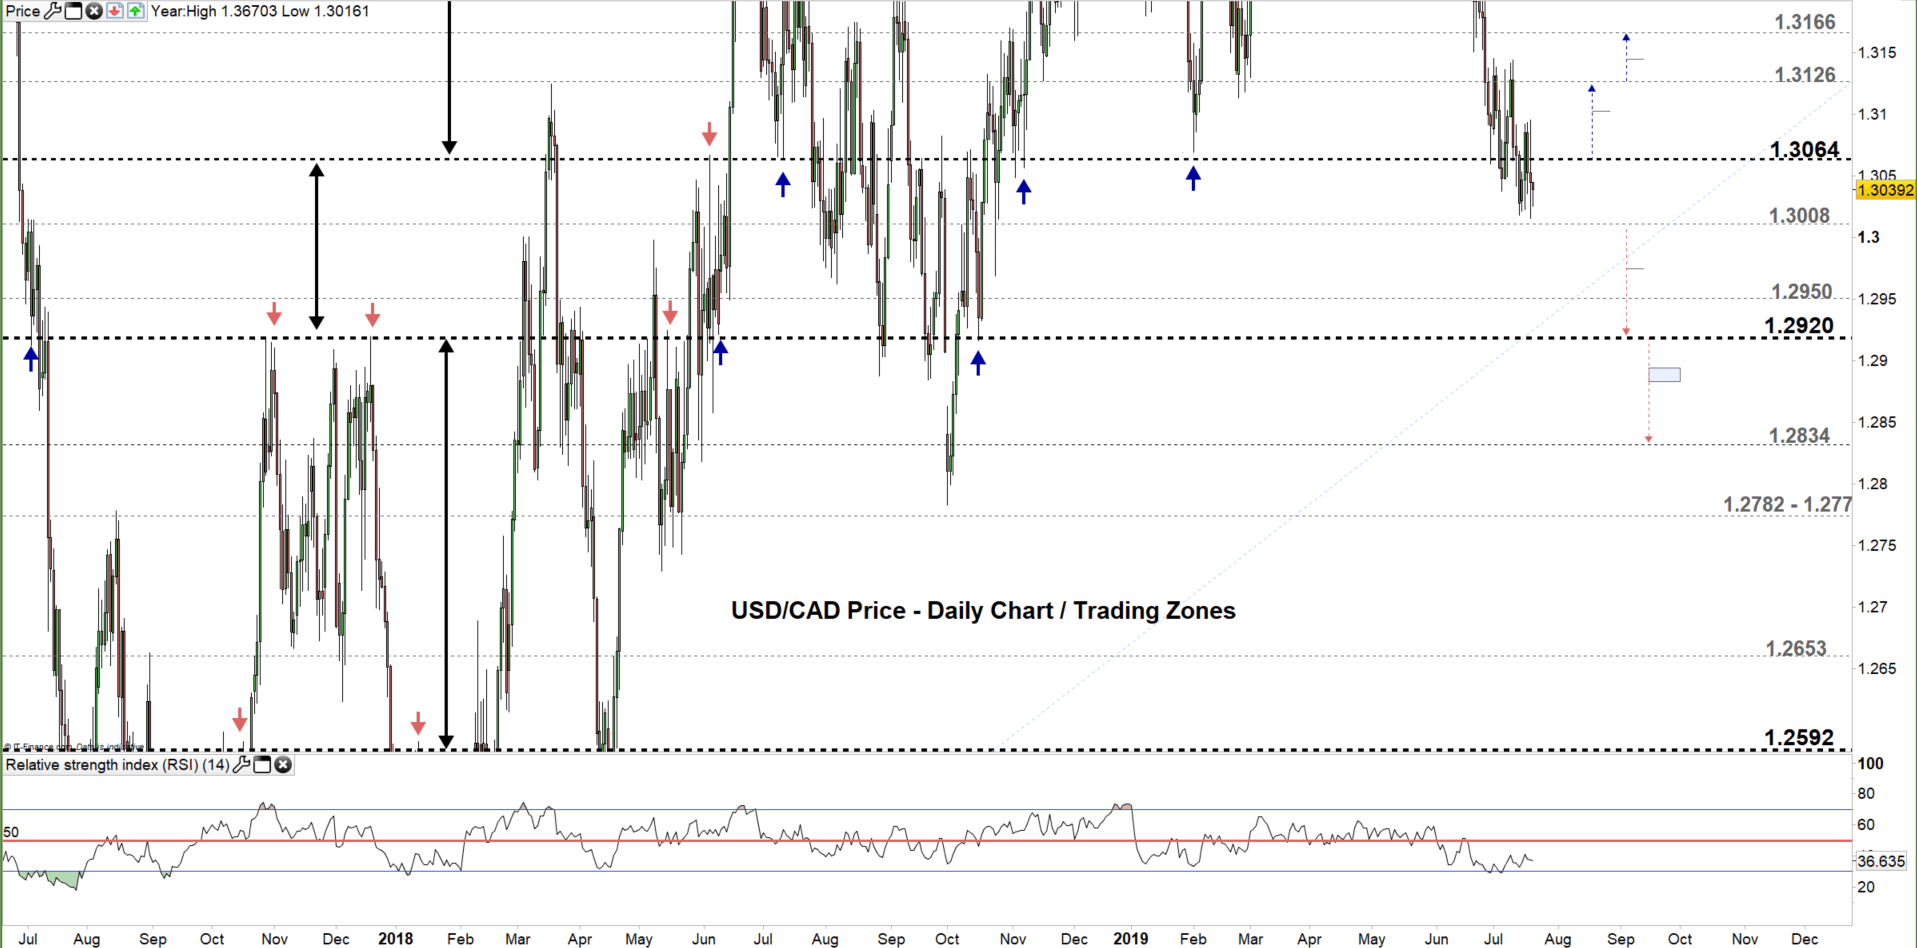
USD/CAD DAILY PRICE CHART (April 15, 2017 – July 19, 2019) Zoomed Out
USD/CAD DAILY PRICE CHART (MAy 19 – JULy 19, 2019) Zoomed In

Looking at the daily chart we notice on Wednesday USD/CAD failed to rally towards 1.3126 and tumbled towards the same old trading zone 1.3008 – 1.3064. The pair currently eyes the low-end of this zone hence, a close below this level may see the price trading towards 1.2920. However, the weekly support levels highlighted on the chart (Zoomed in) need to be kept in focus.
On the other hand, a close above 1.3126 could cause a rally towards 1.3166 although, the weekly resistance level underlined on the chart needs to be watched closely.
Just getting started? See our Beginners’ Guide for FX traders
USD/CAD Four-HOUR PRICE CHART (JUN 28 – JuLY 19, 2019)
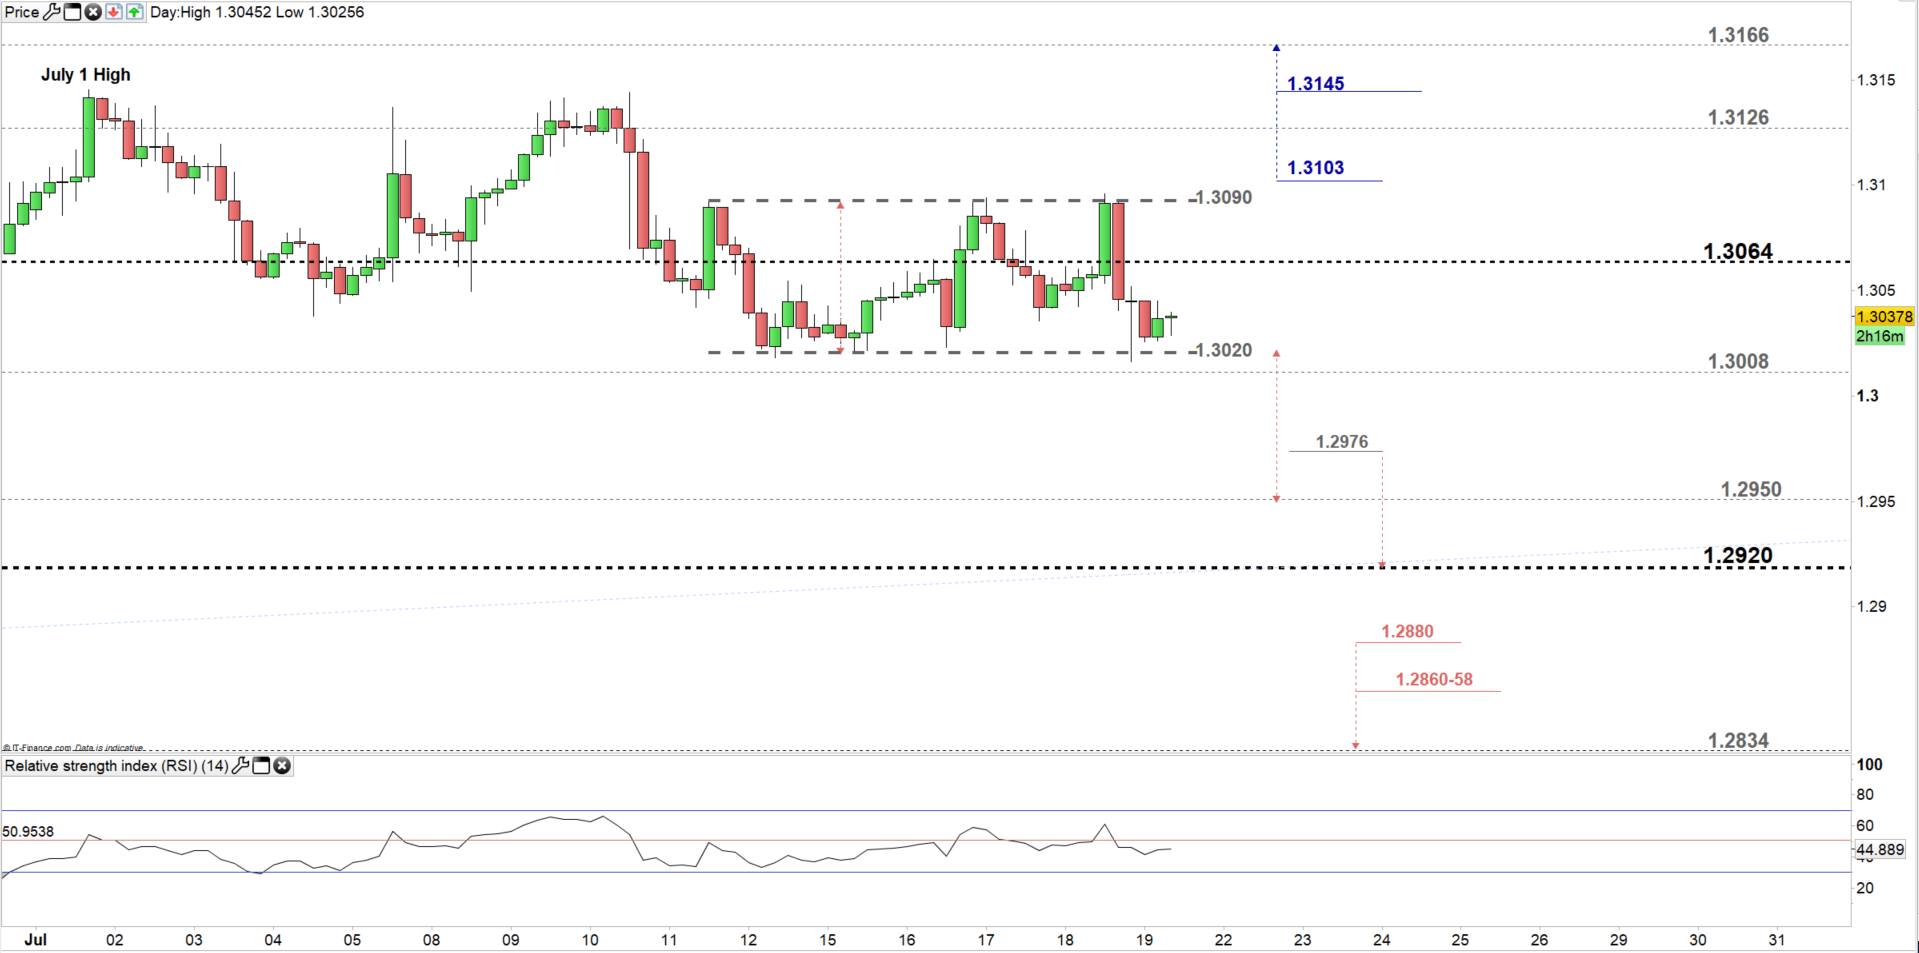
Looking at the four-hour chart we notice since July 11 USD/CAD has been consolidating within a rough 70 pips range. Therefore, a break below 1.2976 may press the price towards 1.2920 although, the weekly support level at 1.2950 needs to be considered. See the chart to know more about the significant support levels in a further bearish scenario.
On the flip-side, a break above 1.3103 could cause a rally towards 1.3166 nonetheless, the weekly resistance levels marked on the chart would be worth monitoring.
Written By: Mahmoud Alkudsi
Please feel free to contact me on Twitter: @Malkudsi


