


USD/CAD Price Forecast, Charts and Analysis
- Eyes on Fed Chairman Paul’s speech today about economic outlook and monitory policy.
- USD/CAD Bearish momentum slows down.
Did we get it right with our US Dollar forecast? Find out more for free from our Q2 USD and main currencies forecasts
USD/CAD – Sellers Holding Fire for Now
On June 19, USD/CAD broke below 1.3289 and kick started a selloff sent the price to the level discussed in our last update at 1.3150. The price rebounded after with the seller likely taking profits.
On June 18, the Relative Strength Index (RSI) dipped below 50 starting a bearish momentum. Today, the oscillator reading is at 34 close by the oversold sold territory.
Having trouble with your trading strategy? Here’s the #1 Mistake That Traders Make
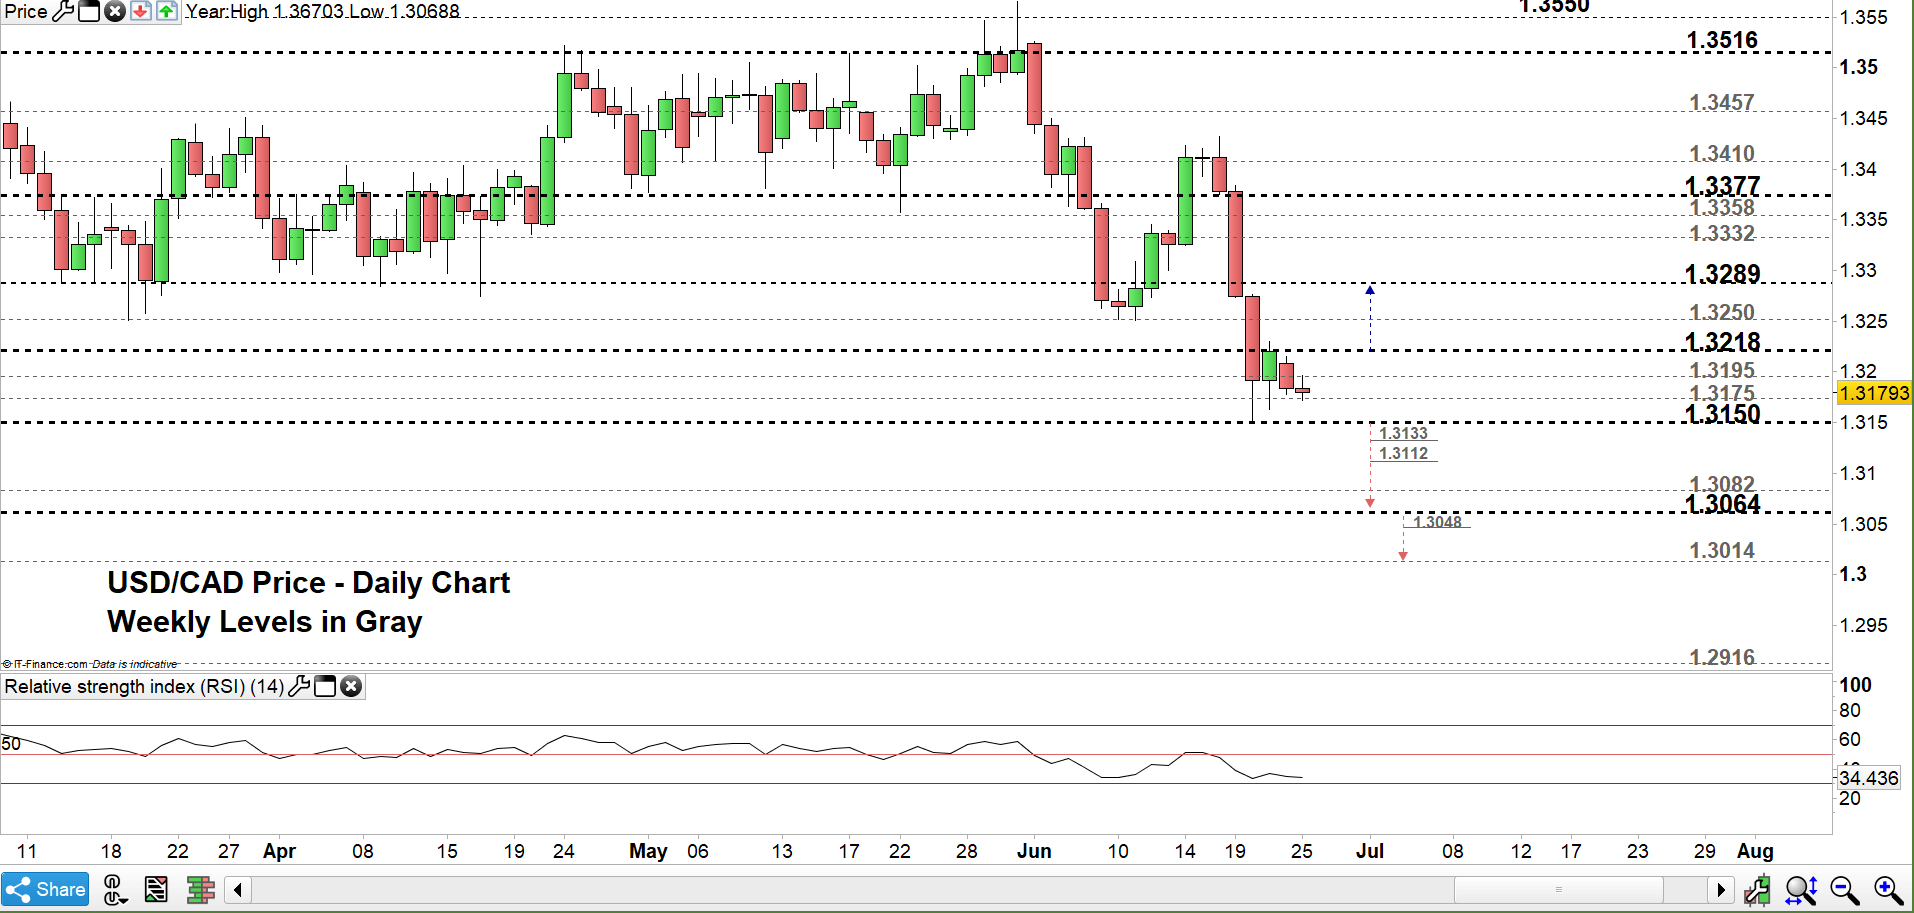
USD/CAD DAILY PRICE CHART (Mar 18, 2019 – JUn 25, 2019) Zoomed In
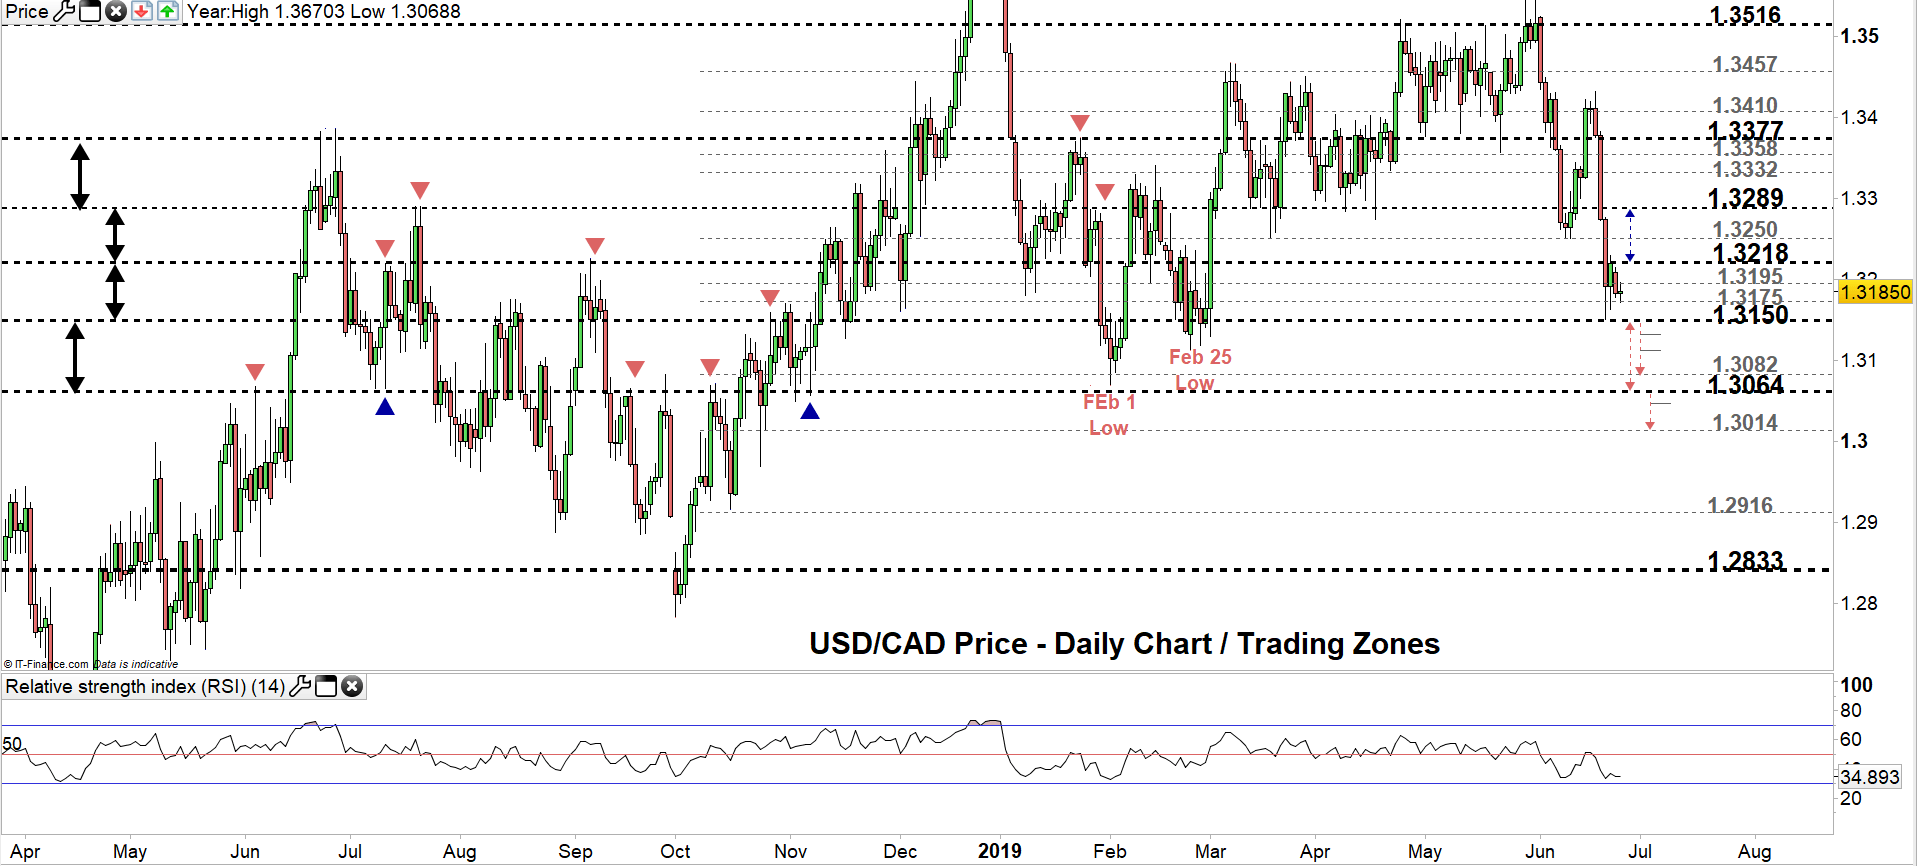
USD/CAD DAILY PRICE CHART (Mar 27, 2018 – JUnE 25, 2019) Zoomed Out
Looking at the daily chart we notice USD/CAD eying the lower end of the trading zone 1.3150 – 1.3218 after failing on Friday to close above the higher end. Hence, a close below the lower end might see the price trading towards 1.3064 however, the highlighted weekly supports on the chart should be watched along the way. See the chart for more details if the pair closed below 1.3064.
In turn, a close above the higher end of the aforementioned trading zone could lead the price towards 1.3289. The weekly resistance at 1.3250 should be monitored closely.
Just getting started? See our Beginners’ Guide for FX traders
USD/CAD Four-HOUR PRICE CHART (Jun 7, 2019 – Jun 20, 2019)

Looking at the four-hour chart, we notice USD/CAD found support on June 20 at 1.3150 then started a sideways movement. Therefore, any break below this threshold may send the pair towards 1.3112 although, the weekly support underlined on the chart needs to be considered. See the chart for more key levels if the price breaks below mentioned levels.
On the other hand, USD/CAD bounced on June 21 carving out a lower high at 1.3230. Therefore, a break above this level may rally the price to test the weekly resistance at 1.3250. See the chart to find out more if the rally continues.
Written By: Mahmoud Alkudsi
Please feel free to contact me on Twitter: @Malkudsi


