


USD/CAD Price Forecast, Charts and Analysis
- Eyes on Canadian retail sales data release tomorrow.
- USD/CAD at its lowest levels in nearly four months.
Did we get it right with our US Dollar forecast? Find out more for free from our Q2 USD and main currencies forecasts
USD/CAD – The Sellers Come Back
On June 17, USD/CAD closed with a Doji pattern reflecting hesitation from the buyers to keep rallying the price. The following day the pair failed to close above the levels discussed in the previous update hence, the sellers found in this an opportunity to take over.
Alongside, the Relative Strength Index (RSI) U turned crossing below 50 on June 18 indicating to the sellers’ come back.
Having trouble with your trading strategy? Here’s the #1 Mistake That Traders Make
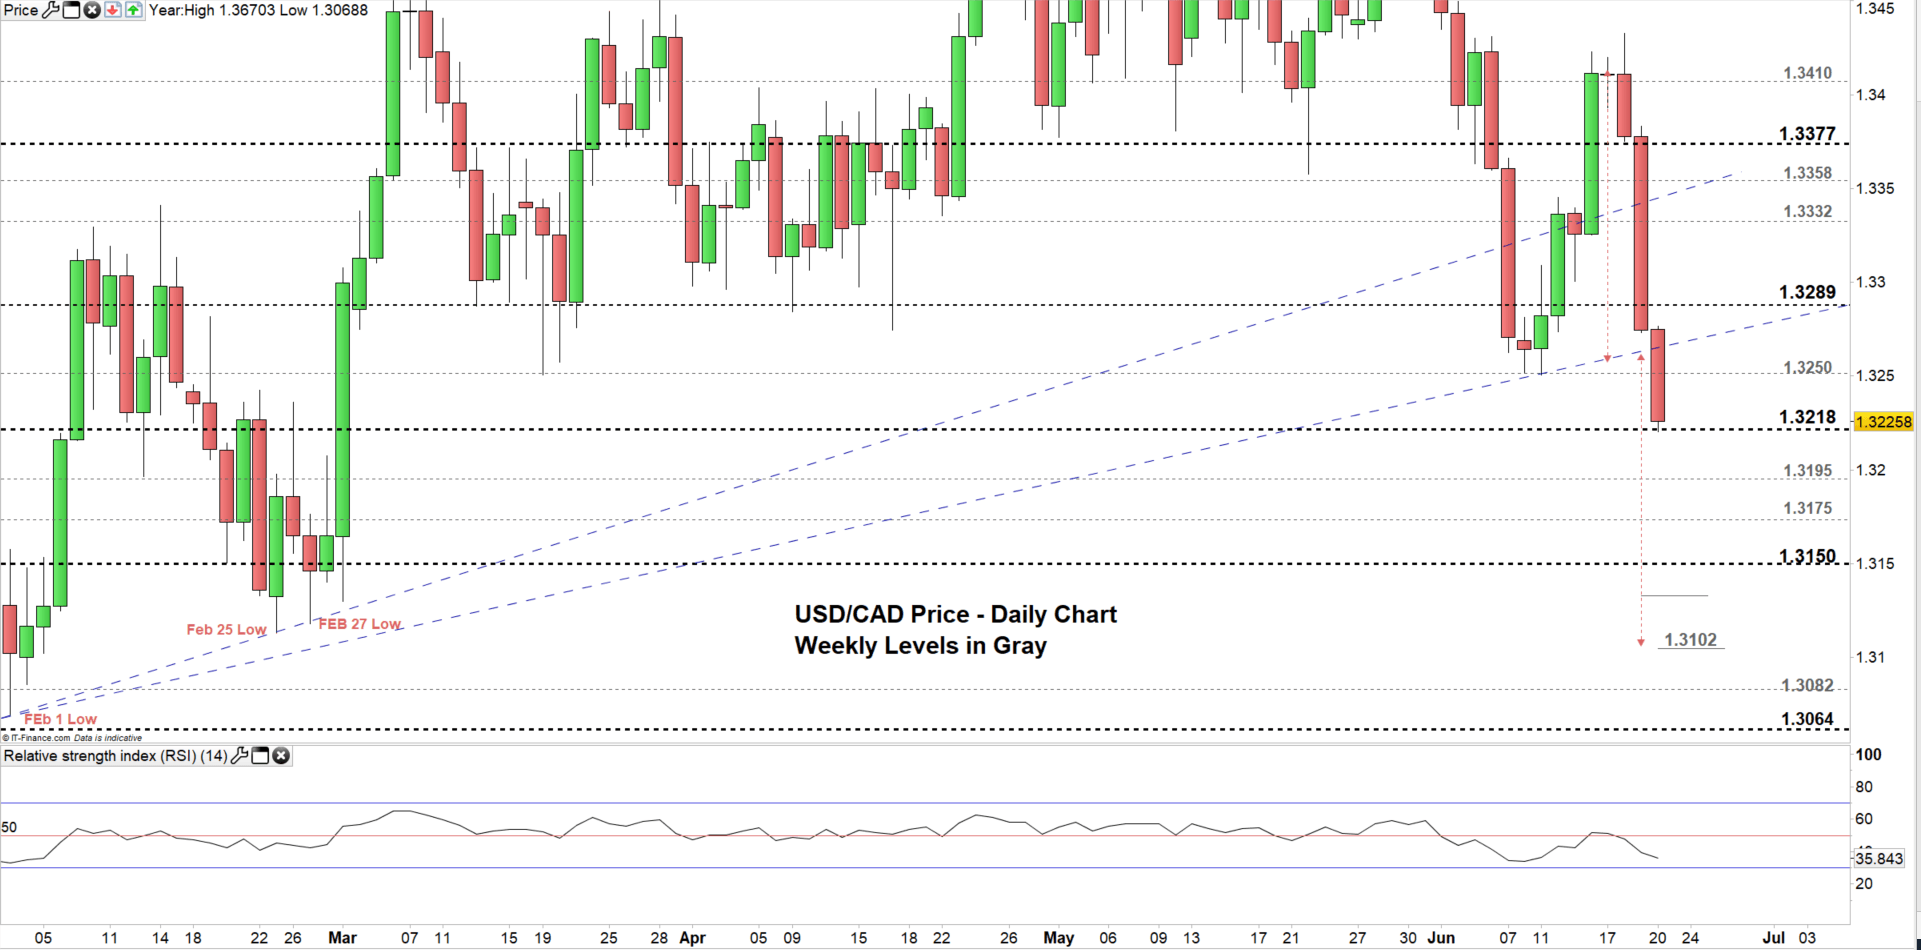
USD/CAD DAILY PRICE CHART (FEB 1, 2019 – JUn 20, 2019) Zoomed In
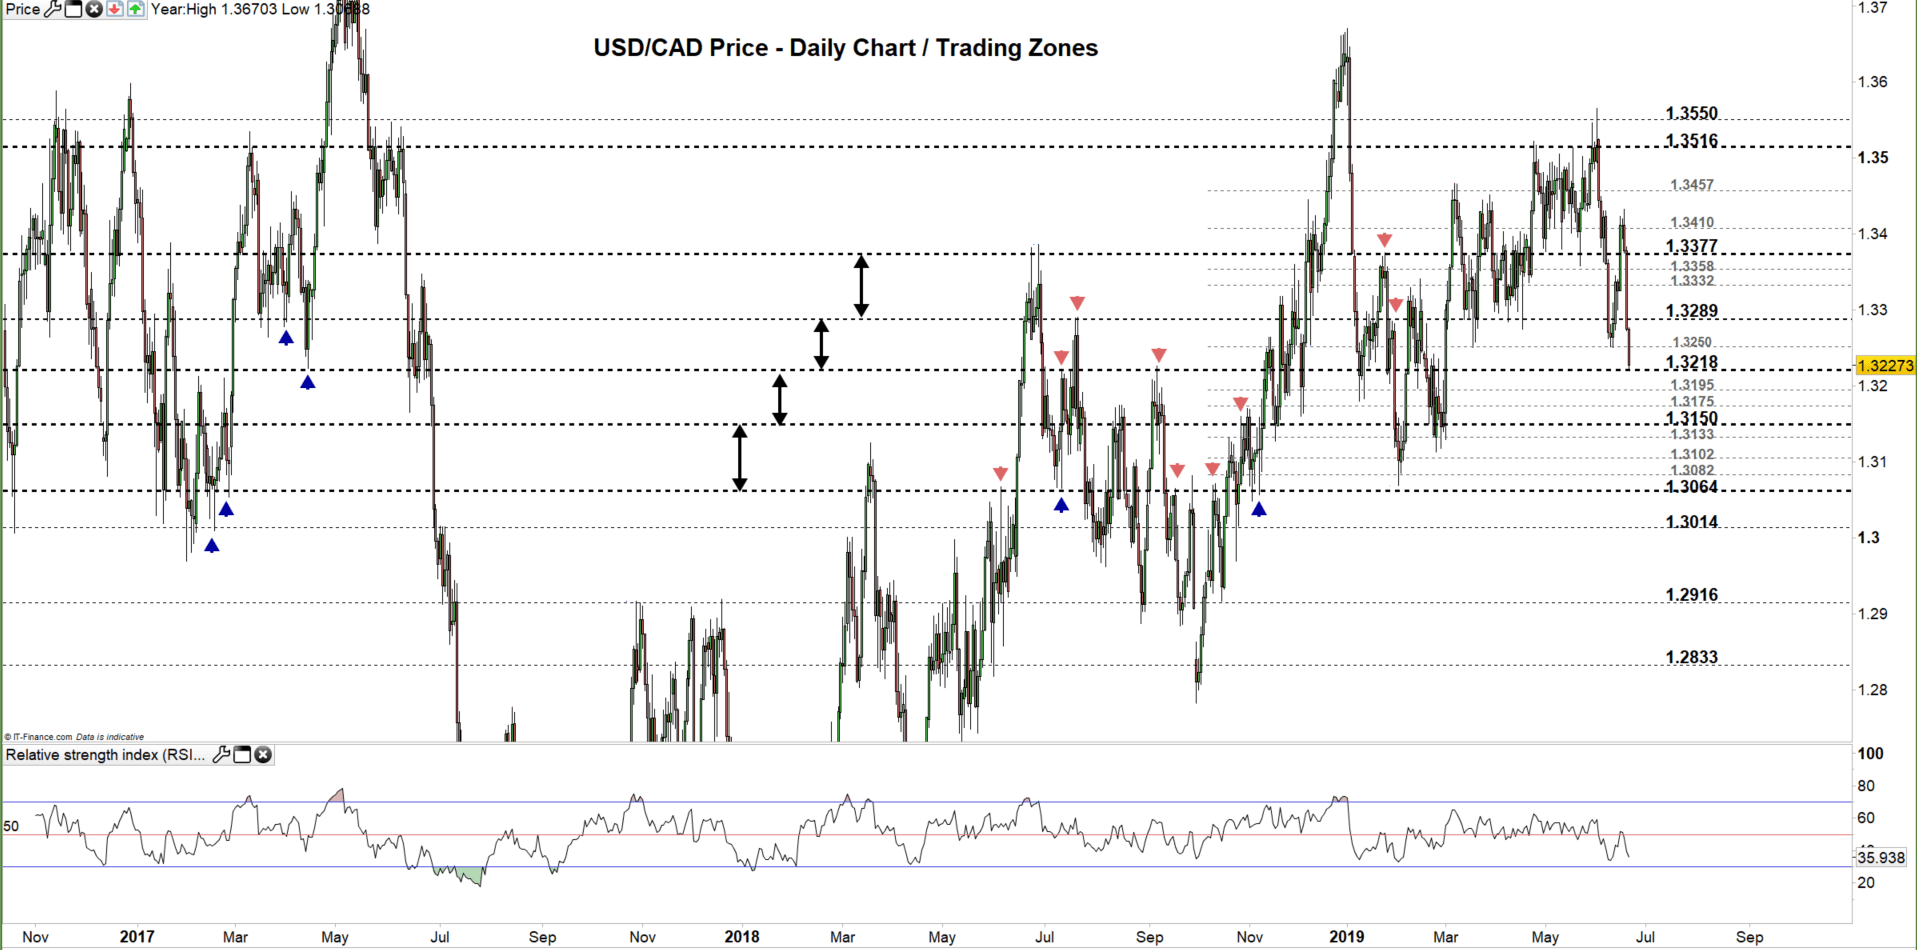
USD/CAD DAILY PRICE CHART (Nov 9, 2016 – JUn 20, 2019) Zoomed Out
Looking at the daily chart we notice USD/CAD eying the lower end of the trading zone 1.3150 – 1.3218 contingent on closing below the higher end. Although, the weekly supports at 1.3195 and 1.3175 need to be kept in focus.
Further bearishness might require a close below the lower end of the trading zone. This could mean USD/CAD head towards 1.3064. However, the weekly support zone from the Feb 27 low at 1.3118 and Feb 25 low1.3112 need to be watched along the way.
Its worth noting that any failure to close below the higher end of the trading zone could rally the price towards 1.3377. However, the weekly resistance at 1.3250 is worth monitoring.
Just getting started? See our Beginners’ Guide for FX traders
USD/CAD Four-HOUR PRICE CHART (Jun 7, 2019 – Jun 20, 2019)

Looking at the four-hour chart, we notice on Jun 18 USD/CAD closed with a Doji pattern signaling a bearish reversal. On the following day the price closed below 1.3377 and this was the turning point to kick start the selloff.
A break below 1.3195 might lead USD/CAD towards 1.3150 contingent on clearing the weekly support level at 1.3175. See the chart for more key levels if the sell off continues below 1.3195.
On the flipside, any break above 1.3250 could rally the price towards 1.3289. The daily resistance at 1.3276 needs to be considered.
Written By: Mahmoud Alkudsi
Please feel free to contact me on Twitter: @Malkudsi


