


Talking Points:
-USD/CAD Technical Strategy: On Watch For Down < 1.2841 to Carry Toward 1.25
- Trader Sentiment Warns a Coiled Move Lower Could Be Around the Corner
- Looking For Clear Short-Term USD/CAD Levels Updating In Real-Time? Check Out GSI
Quick Fundamental Take:
Will the price of the Canadian Dollar break or follow the recent breakout in WTI Crude Oil? That is a question worth asking in the second half of August. We recently saw in the Commitment of Traders report from the CFTC that leveraged institutional funds have shifted to a net short CAD position from a net long position the week prior. From an internal perspective of the Canadian Economy, a short CAD position has some credibility.
Economic announcements in Canada have steadily underperformed economists expectations since late April as shown via the Economic Surprise Index for Canada. Recently, we saw housing data out of Vancouver that showed the once-high-flying Real Estate markets now leads the third straight fall month over month in Canadian Home Sales. Earlier this month, the provincial government placed a foreign buyers’ tax for Vancouver home, but inflated prices may have put a dent in sales even before the tax went into effect.
Access Our Free Q3 Dollar Outlook As The US Dollar Reserve Status Makes It A Possible Haven
Another key development worth watching as Q3 and H2 2016 get under way is the directional bias in WTI Crude Oil (CFD: USOil).So far, Oil looks to have found new life and may be pushing back toward resistance near ~$49/bbl at a time when the US Dollar is showing few signs of another Bull Market.
Technical Focus:
Long-Term Chart:
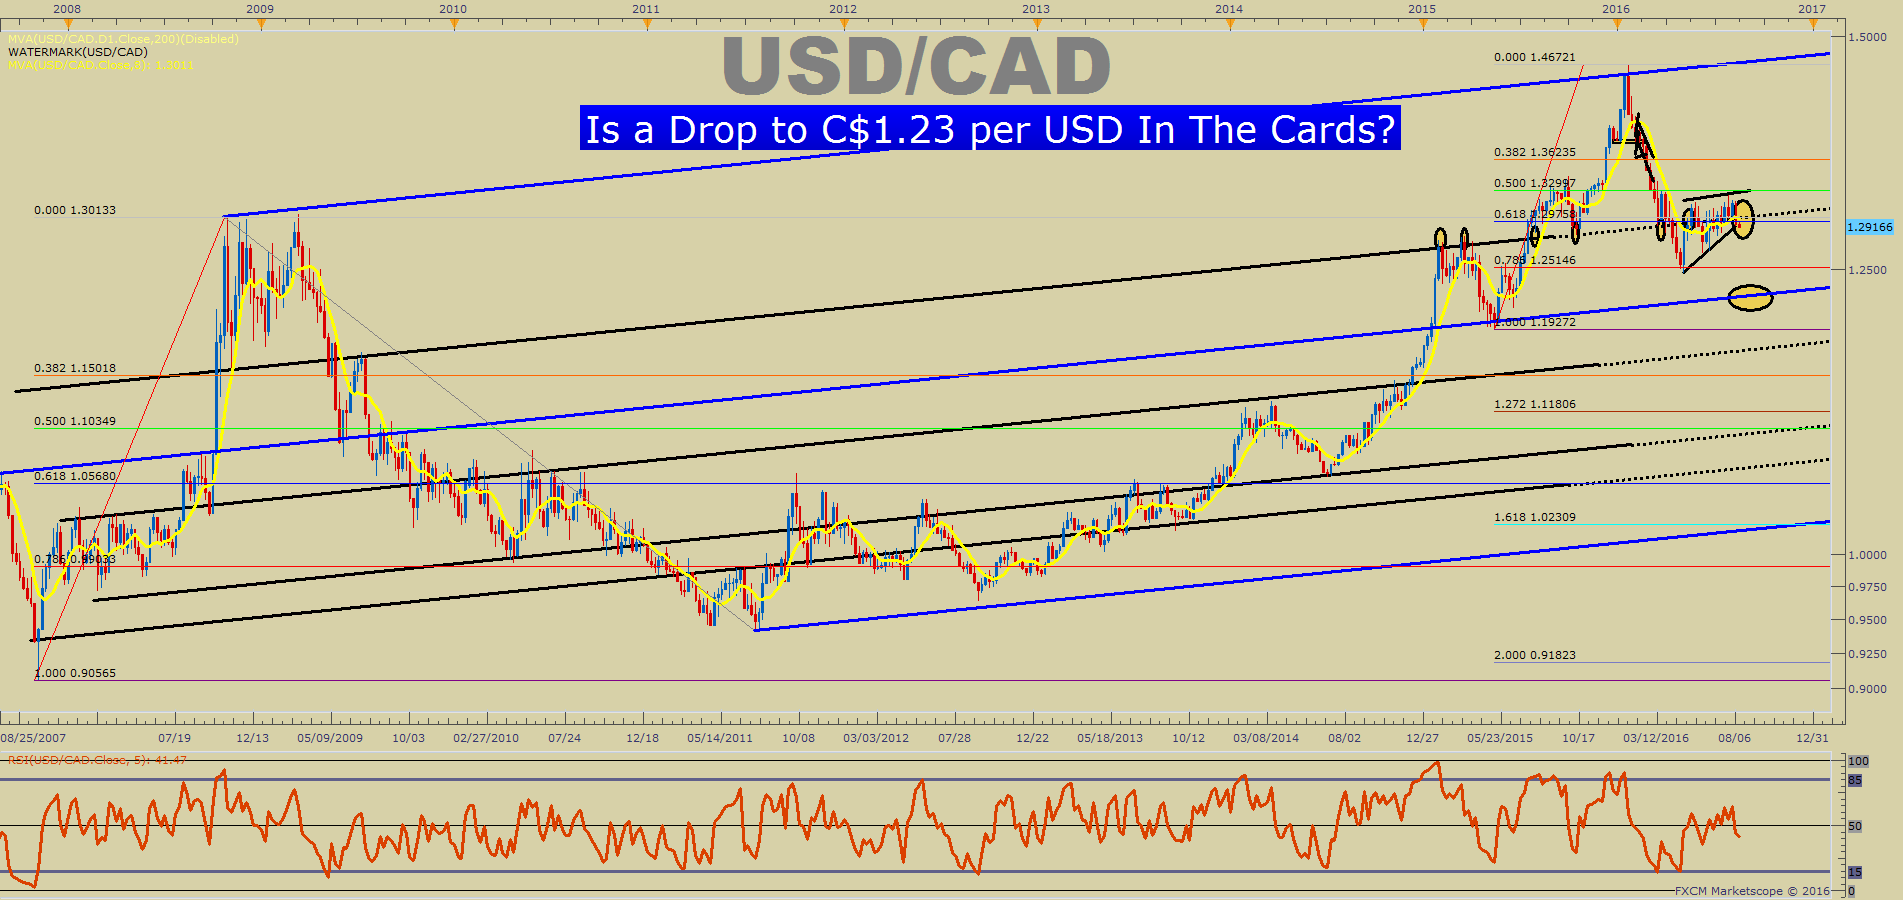
A quick note on the long-term (9-Year, Weekly Chart) can be a helpful way to put yourself in the right frame of mind about long-term moves in USD/CAD. On the far right side of the chart, you can see the sideways price action that began in early May, which now represents a Bear Pennant.
The chart below shows the pattern in more detail. A Bear Pennant is a continuation pattern that if we can break below the gang of support below, could open up a flood of selling in the pair. Given the recent strength of Oil, which is positively correlated to the price of Crude Oil with a correlation coefficient over the last month of +0.49. The correlation coefficient is the lowest level in 18-months.
The last point on the chart above is to watch the long-term Median Line that sites at ~1.23. Again, a break below ~1.2840, which is the H2 Macro Opening Range low would immediately turn focus to 1.23 that aligns with the Median Line where USD/CAD bounced in May 2015.
Median Term: USD/CAD Is Now Putting Pressure on Support That May Not Hold

Interested In Learning the Traits of Successful Traders? If So, Click Here
The chart above is a good explanation on the difference between a price and time correction. The move from late January to early May was a classic price correction. In shortorder, the price of USD/CAD dropped ~15% in a bit more than four months, which many felts was a long overdue move given the recent rally and other attributed more to the strong move higher in Oil.
In 78.6% of the time consumer as in the initial price drop (as shown with the vertical lines on the chart above), the price of USD/CAD has a little more than ~6%. While a move higher has taken place, the move has been more of time consumption > price consumption.
See How Live Clients Are Positioned in FX & Equities Here
It appears now that focus should be if we’re about to move into another phase of a price correction similar, albeit likely weaker than the January-May move. A break below the H2 2016 Macro Opening Range Low of 1.2840 would be the first indication that this move could be under way.
Canadian Dollar Has Regained Favorper Sentiment
USD/CAD Speculative Sentiment Index as of Monday, August 15, 2016

Combining the technical picture above, with the sentiment picture, and the Intermarket analysis, there continues to be evidence for a possible breakdown if USD/CAD can break below 1.2850.
The ratio of long to short positions in the USDCAD stands at 1.48 as 60% of traders are long. Yesterday the ratio was 1.43; 59% of open positions were long. Long positions are 0.6% higher than yesterday and 42.6% above levels seen last week. Short positions are 3.1% lower than yesterday and 20.5% below levels seen last week. Open interest is 0.9% lower than yesterday and 0.1% above its monthly average.
We use our SSI as a contrarian indicator to price action, and the fact that the majority of traders are long gives asignal that the USDCAD may continue lower. The trading crowd has grown further net-long from yesterday but unchanged since last week. The combination of current sentiment and recent changes gives a further bearish trading bias.
Key Levels as of August 15, 2016

T.Y.


