


To receive Tyler’s analysis directly via email, please SIGN UP HERE
Talking Points:
- Crude Oil Technical Strategy: Rally May Run On Due To Light Volume
- 50% Fibonacci Retracement Looks To Be A Natural Reversal Point
- Sentimental Trading System Is Beginning To Flash Buy Signals
Access Our Free Q3 Oil Outlook As Oil's Best Quarter Looks For Confirmation
After last week’s strong move higher in the price of WTI Crude Oil (CFD: USOIL), the price of Oil is higher Year on Year. The fundamental catalyst for the Bullish move in Oil was initially the announcement by Saudi Arabia’s Oil Minister that there might be discussions next month in Algiers to support prices, which was read as a potential production cut. On Monday, Oil continued to advance more than 100%, and now traders have their sets on new, more bullish targets.
Track short-term Crude Oil price levels and patterns with the GSI indicator!
With the price of Oil above $45/bbl for the first time in threeweeks, institutional speculators are getting in on the move. Hedge funds have taken a Bullish stance on WTI per futures positioning according to the CFTC. The shift to long positions by institutional money managers increased to their highest amount since January right before the last strong move higher from the high-$20/bbl zone to the low $50/bbl.
Crude Oil Price Chart Rises Toward Well Identified Resistance

The chart above has done a fine job of framing price action in WTI Crude Oil. After failing at the topchannel in June, the price quickly dropped down to a pre-identified zone provided by the median line and the Fibonacci Retracement levels in focus between $41.85-$35.22/bbl. As you can see now, we’ve bounced through an internal trend-line that may show there is more strength to come.
If the price of WTI Crude Oil closes above $46/bbl this week, the daily chart patterns will have formed a Bullish breakout from a Bear Flag. Such developments tend to have followed through, and we could see a follow through up to the 100-WMA (notpictured) all the way up ~$49.77.
Given the light volume of mid-August, it’s often folly to fight quick moves even though true breakouts have less participation. Furthermore, a rather weak Dollar is not standing in the way of Oil advancing further.
Bottom Line:
The recent price action in Crude Oil has been encouraging. The 5%+ rise in the price of Oil last week was the largest move in three months and has naturally aligned with the risk-on narrative of breakouts in equities and a rather sanguine US Dollar.
The Rebalancing rumors have served their purpose, and now the market will likely look for confirmation, which has been less reliable. One encouraging component is that Iran has lifted their production to a pre-determined level, which provides more credibility to the idea that they may join the productionfreeze agreement if one arises.
Contrarian System Beginning To Favor Upside Risk as of 8/15/16
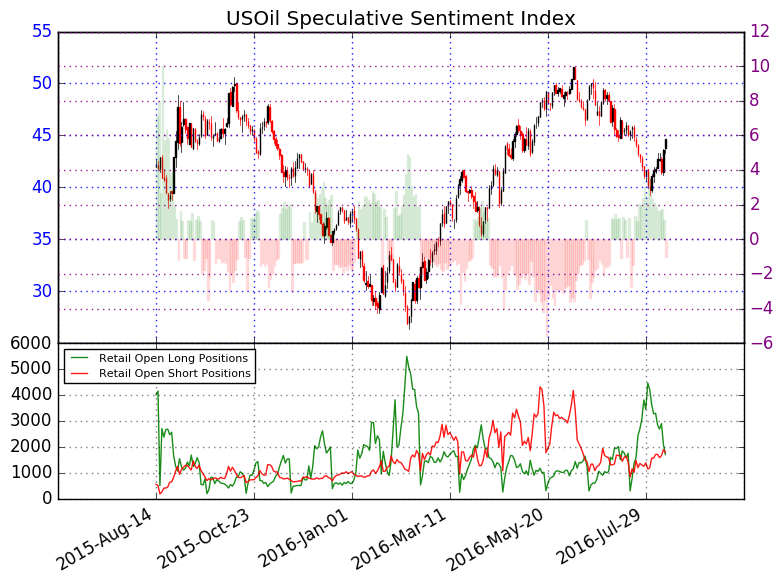
In addition to the technical focus, we should keep an eye on retail sentiment. The upsideis beginning to align with our Speculative Sentiment Index or SSI for now.
As of mid-day Monday, The ratio of long to short positions in the USOil stands at -1.05 as 49% of traders are long. Yesterday the ratio was 1.22; 55% of open positions were long. Long positions are 27.2% lower than yesterday and 49.3% below levels seen last week. Short positions are 7.1% lower than yesterday and 21.9% above levels seen last week. Open interest is 18.2% lower than yesterday and 14.5% below its monthly average.
We use our SSI as a contrarian indicator to price action, and the fact that the majority of traders are short gives asignal that the USOil may continue higher. The trading crowd has flipped from net-long to net-short from yesterday and last week. The combination of current sentiment and recent changes gives a further bullish trading bias.
Key Levels Over the Next 48-hrs of Trading As of August 15, 2016

T.Y.
Think Oil has more room to run? Trade Oil With Low Margin Requirements (non-US Residents only)


