Interested In Learning the Traits of FXCM’s Successful Traders? If So, Click Here
Talking Points:
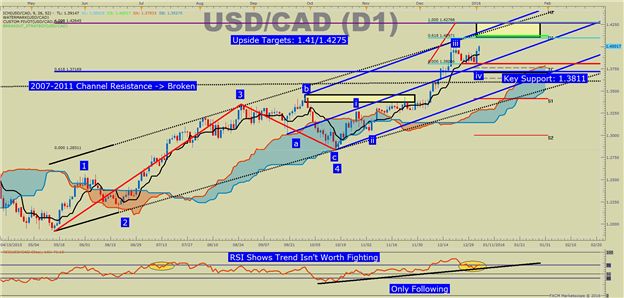
-USD/CAD Technical Strategy: Buy the Dip Above 1.3812
-USD/CAD continues to hold above upper bound of long-term bull channel
-1.3811 January 4th Low to Act as Swing Support
USDCAD is a wonder to behold. Since May of 2015, there has been a few retracement into the key Fibonacci zone of 38.2-61.8% in June & October of the prior impulse, but aside from those short-term counter-trend moves, USDCAD seems to be taking the elevator higher, forget the stairs. Looking across the board, it seems like USDCAD does not intend to slow down whether looking at momentum via RSI, Crowd Sentiment Continues to Favor USD/CAD Gains, or trend following indicators like moving averages. On the chart below, you will also notice a line that is drawn from a bullish channel of the 2007-2011 low to the 2009 high on the weekly chart. The hold above that line is additionally bullish.
Given the strength of the current move, which has pushed USDCAD to the highest level since 2003 at 1.4019, it is more important to discuss support than resistance. By looking at the support levels, we can take ourselves out of the 81% of retail traders fighting this trend (they likely haven’t been reading this articles anyway), and focus on the 19% who are following this move higher along with other USD upside moves like USDSEK higher & NZDUSD lower. For now, the most important support is the January/ YTD low of 1.3811 that was also the December 28 low. Because USDCAD has been in a 1.38/1.40 range for three weeks, we can look to that sideways move as a correction suggesting the trend is resuming impulsively higher again. The trend resumption was evidenced by the very aggressive move above 1.4000 that touched 1.4019 on the highest hourly interbank volume since the days following FOMC’s rate hike.
While the trend is strong and worth following above 1.3811, there are specific targets to the upside starting with 1.4100. This target aligns with the Weekly R1 Pivot and is 61.8% of the initial move off the mid-May low projected higher from 1.3811. Above 1.4100, traders can look to 1.4275/43, which is the top of the channel drawn from the late August high and is 100% of the initial move off the mid-May low projected higher from 1.3811. Another sign of the strength of the move is that RSI (14) broke above 70 in a similar fashion to USD-CAD in July as it was in the midst of overtaking 1.3000 from 1.1900 a few months ago. If nothing else, RSI helps us to see that the trend is not worth fighting; only following for now.
To see how FXCM traders are positioned, click here.