Skip to Content
News & Analysis at your fingertips.

We use a range of cookies to give you the best possible browsing experience. By continuing to use this website, you agree to our use of cookies.
You can learn more about our cookie policy here, or by following the link at the bottom of any page on our site. See our updated Privacy Policy here.

Free Trading Guides
Subscribe
Please try again
Select

Live Webinar Events

0

Economic Calendar Events

0

Notify me about

Live Webinar Events
Economic Calendar Events

H

High

M

Medium

L

Low
More View More
US Dollar Index (DXY) Breaking Out of Bearish Price Pattern

US Dollar Index (DXY) Breaking Out of Bearish Price Pattern

What's on this page

USD Technical Highlights:

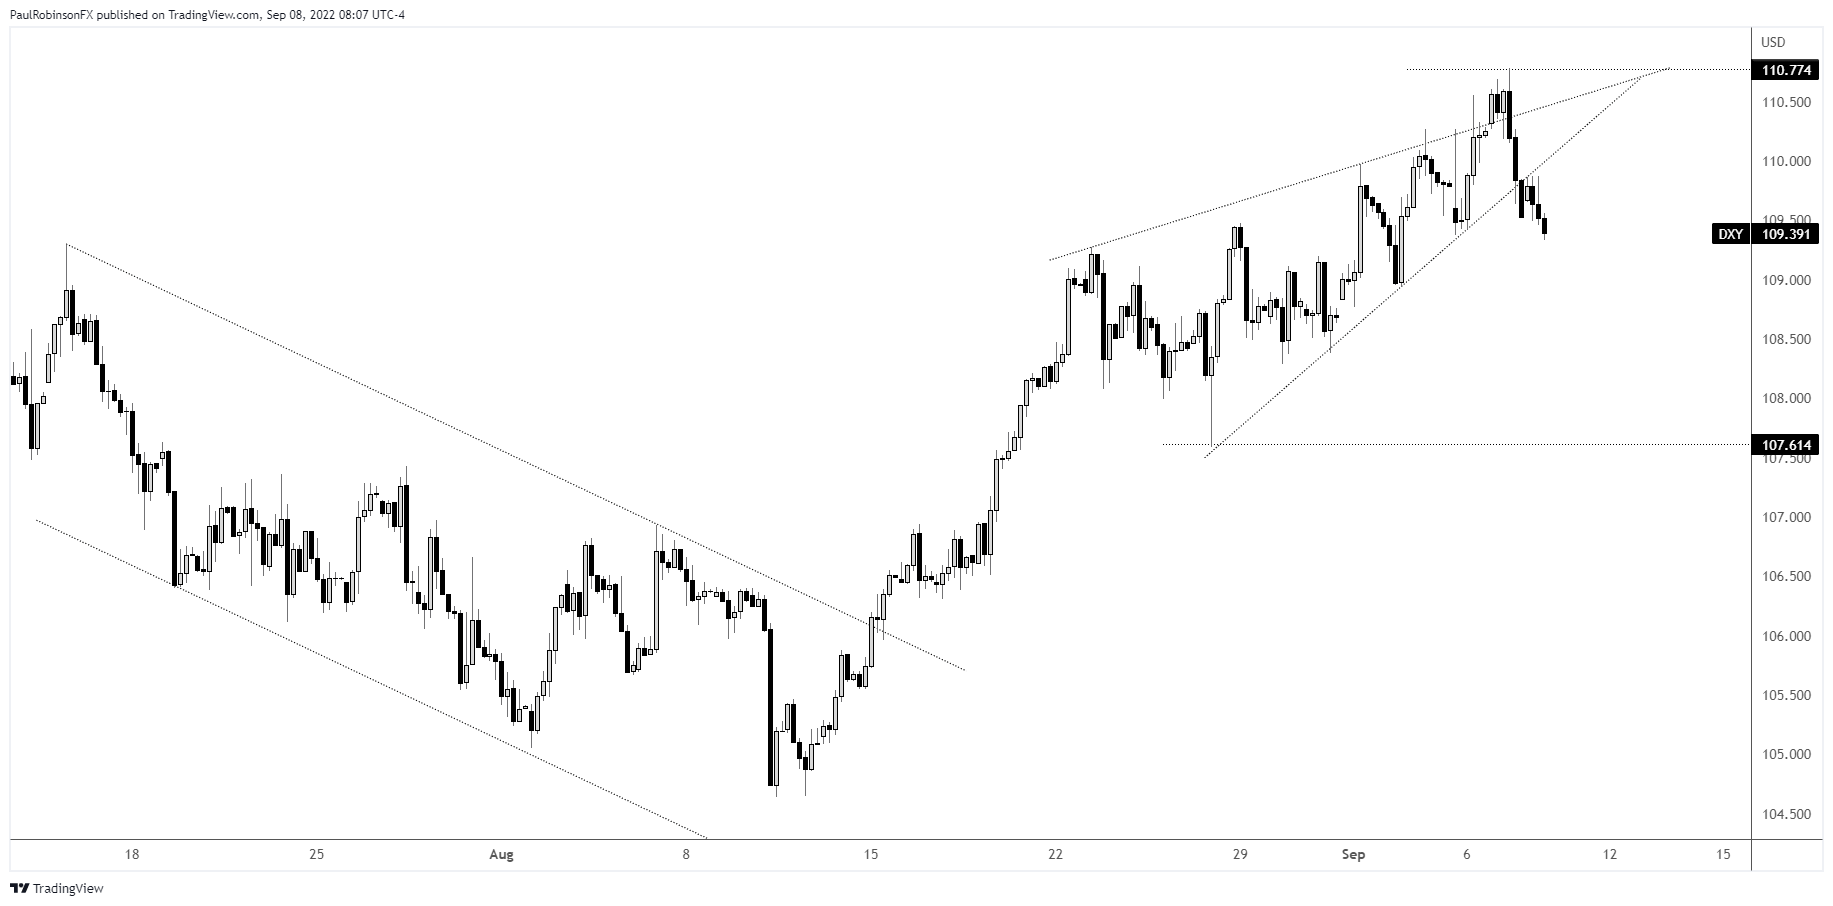
  • DXY falling out of rising wedge after head-fake
  • Looking for the bottom of the pattern at the least
EUR Forecast
EUR Forecast
Recommended by Paul Robinson
Check out the Q3 USD Forecast
Get My Guide

The DXY head-faked higher yesterday out of a rising wedge and with it now breaking down out of the bottom-side line of the pattern it appears on its way lower. It will take a reversal and breakout about the high at 110.78 to negate a bearish trading bias. Looking for support down around 107.59.

Watch the video above for the full set of details.

US Dollar Index (DXY) 4-hr Chart

dxy 4-hr chart

DXY Chart by TradingView

Resources for Forex Traders

Whether you are a new or experienced trader, we have several resources available to help you; indicator for tracking trader sentiment, quarterly trading forecasts, analytical and educational webinars held daily, trading guides to help you improve trading performance, and one specifically for those who are new to forex.

---Written by Paul Robinson, Market Analyst

You can follow Paul on Twitter at @PaulRobinsonFX

DailyFX provides forex news and technical analysis on the trends that influence the global currency markets.

DISCLOSURES