


USD Technical Outlook
- DXY wedge breakout getting messy
- The trend is up until it isn’t, general trading bias higher
US Dollar Technical Outlook: DXY Chart Getting Sloppy into Holidays
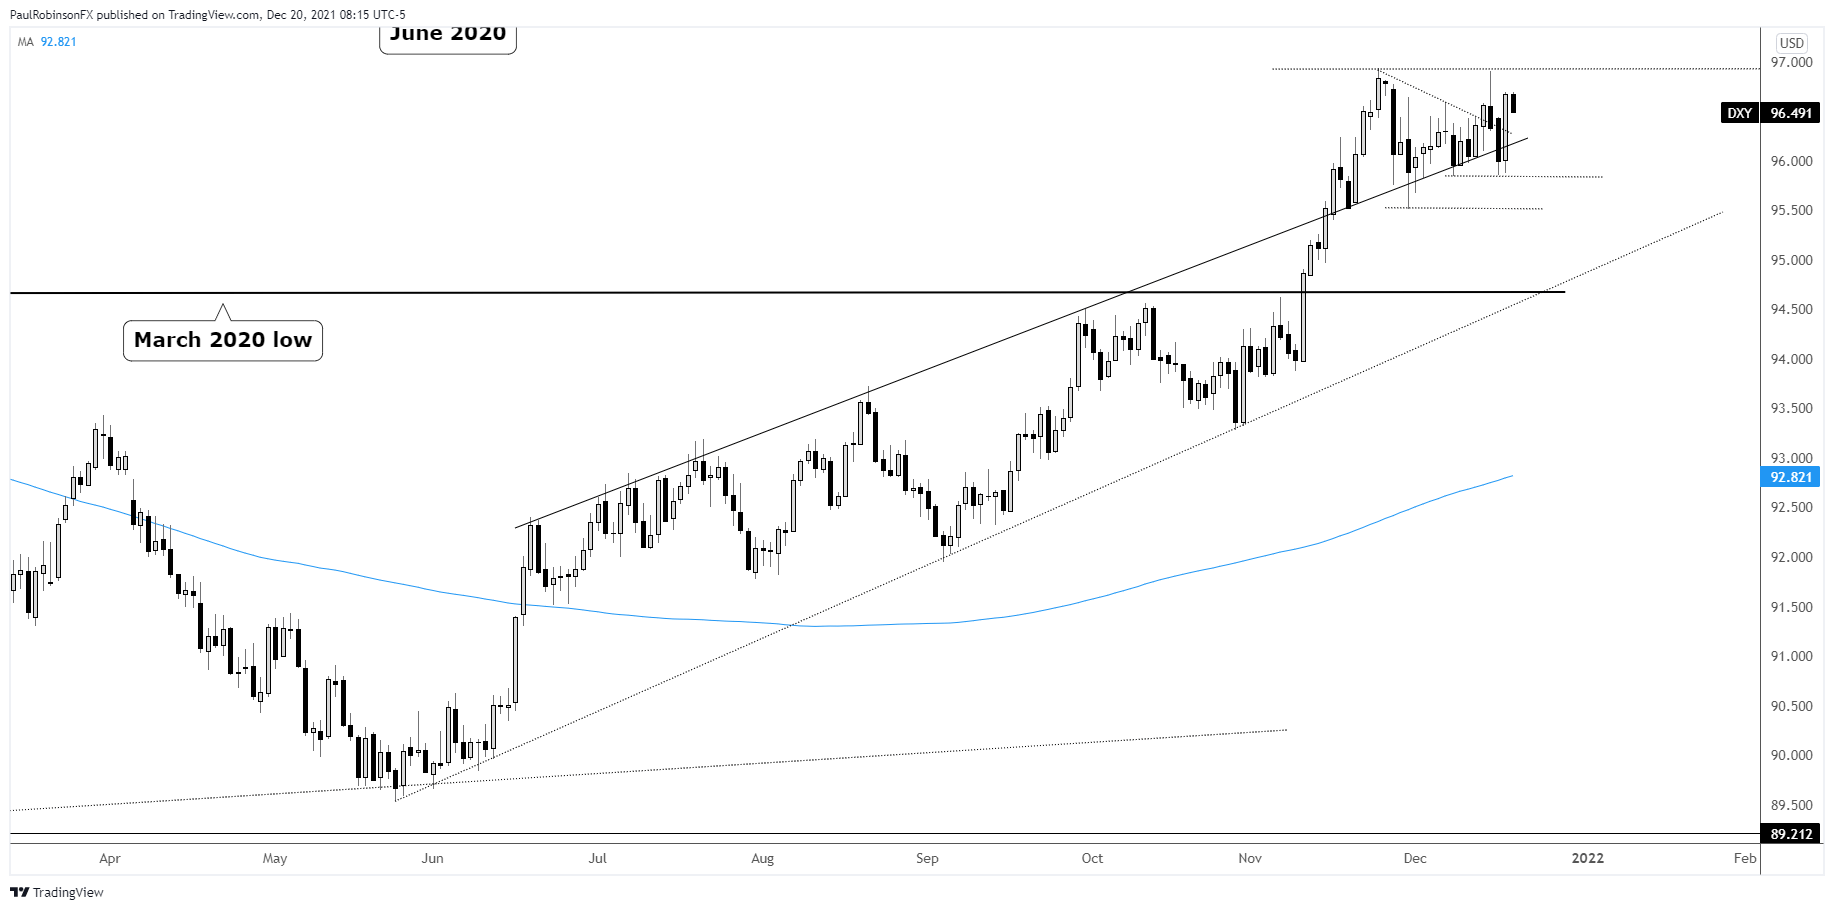
The US Dollar Index (DXY) had a nicely forming wedge heading into last week’s slew of central bank activity, and it looked as though there was going to be a clean trigger and directional move prior to holiday trading setting in.
But this is no longer appearing to be the case, as the chart gets sloppy. It is common for triangles to fake-break before reversing in the sustainable direction, but now with the timing of holidays it is becoming a bit of a toss-up as to how to play things here.
The break higher and reversal (triangle fake-out breakout) on the FOMC appeared to set things up for a move lower, while the breakdown out of the triangle and decline below the slope from June appeared ready to confirm the move. However, the inability to decline below 95.85 prevented downside confirmation.
In fact, not only did the DXY fail to decline below 95.85, it is used that level as the exact low on Thursday. All-in-all, support kept the upside intact. The trend remains pointed higher for the DXY, and as such it appear prudent to continue giving the trend the benefit of the doubt.
Trade might be choppy here on through the end of the year with liquidity getting drained through reduced participation. The general trading bias is really to do nothing at this time.

US Dollar Index (DXY) Daily Chart
US Dollar Index (DXY) 4-hr Chart

Resources for Forex Traders
Whether you are a new or experienced trader, we have several resources available to help you; indicator for tracking trader sentiment, quarterly trading forecasts, analytical and educational webinars held daily, trading guides to help you improve trading performance, and one specifically for those who are new to forex.
---Written by Paul Robinson, Market Analyst
You can follow Paul on Twitter at @PaulRobinsonFX


