


USD Technical Outlook
- DXY wedge set to get resolved after fake-out breakout
- This fake-out could lead to a decent downdraft
US Dollar Technical Outlook: DXY Tightropes Support, Looks for Catalyst
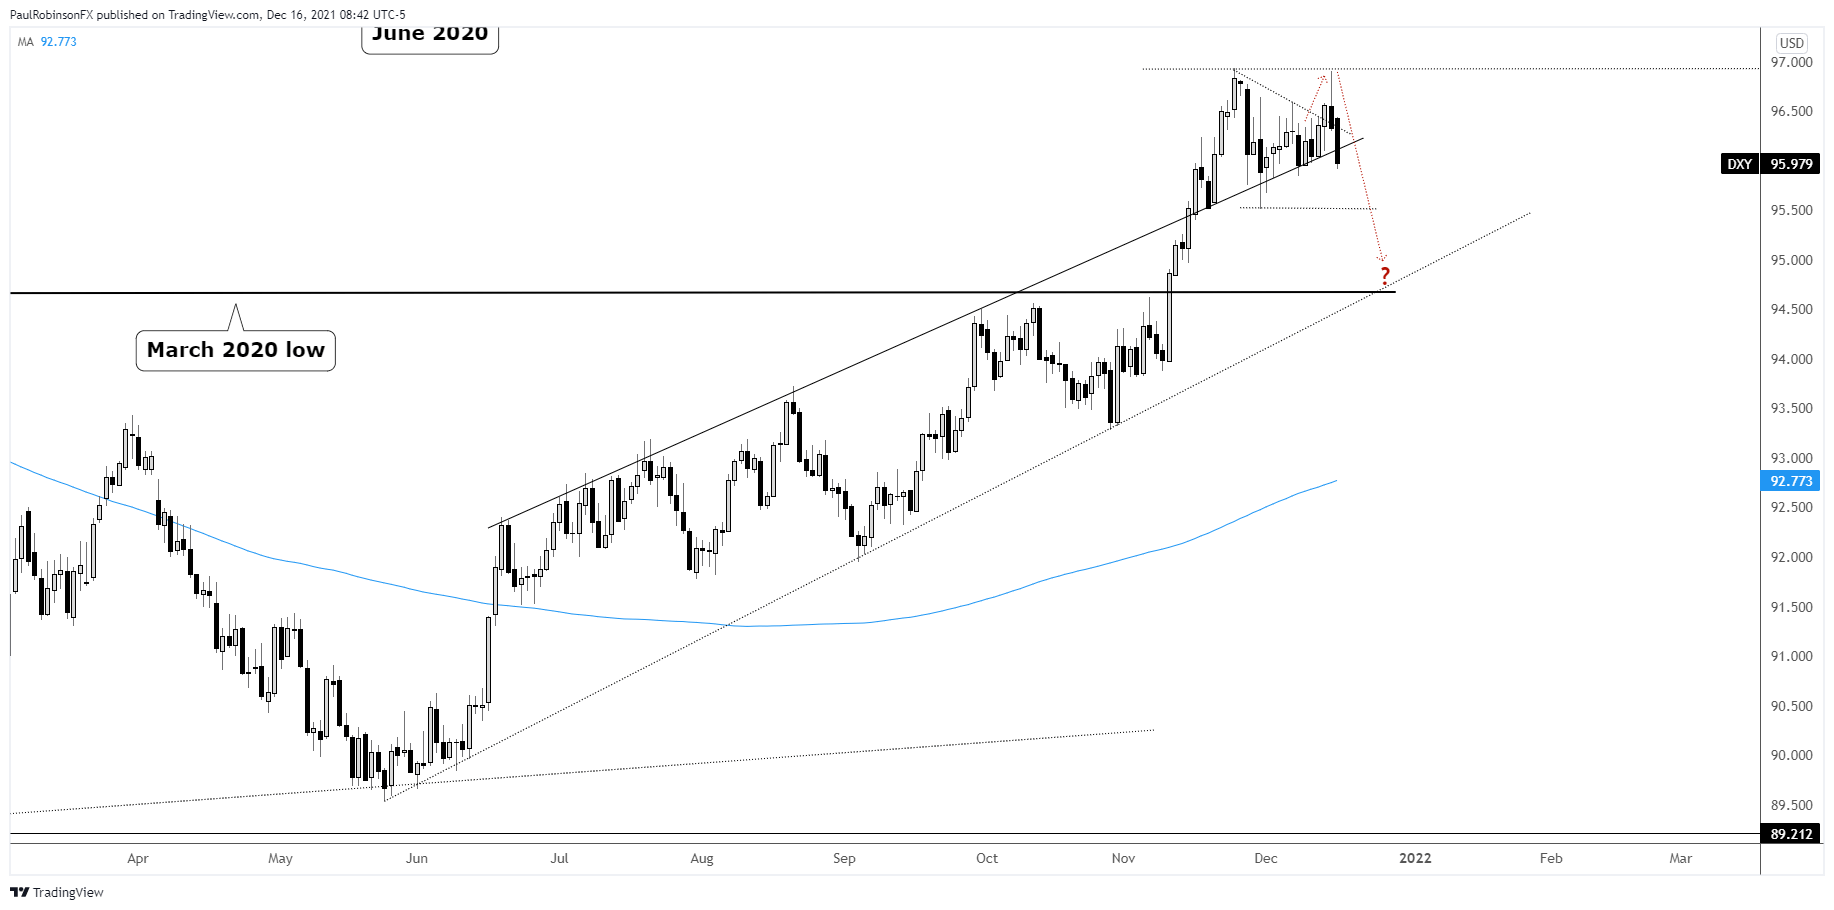
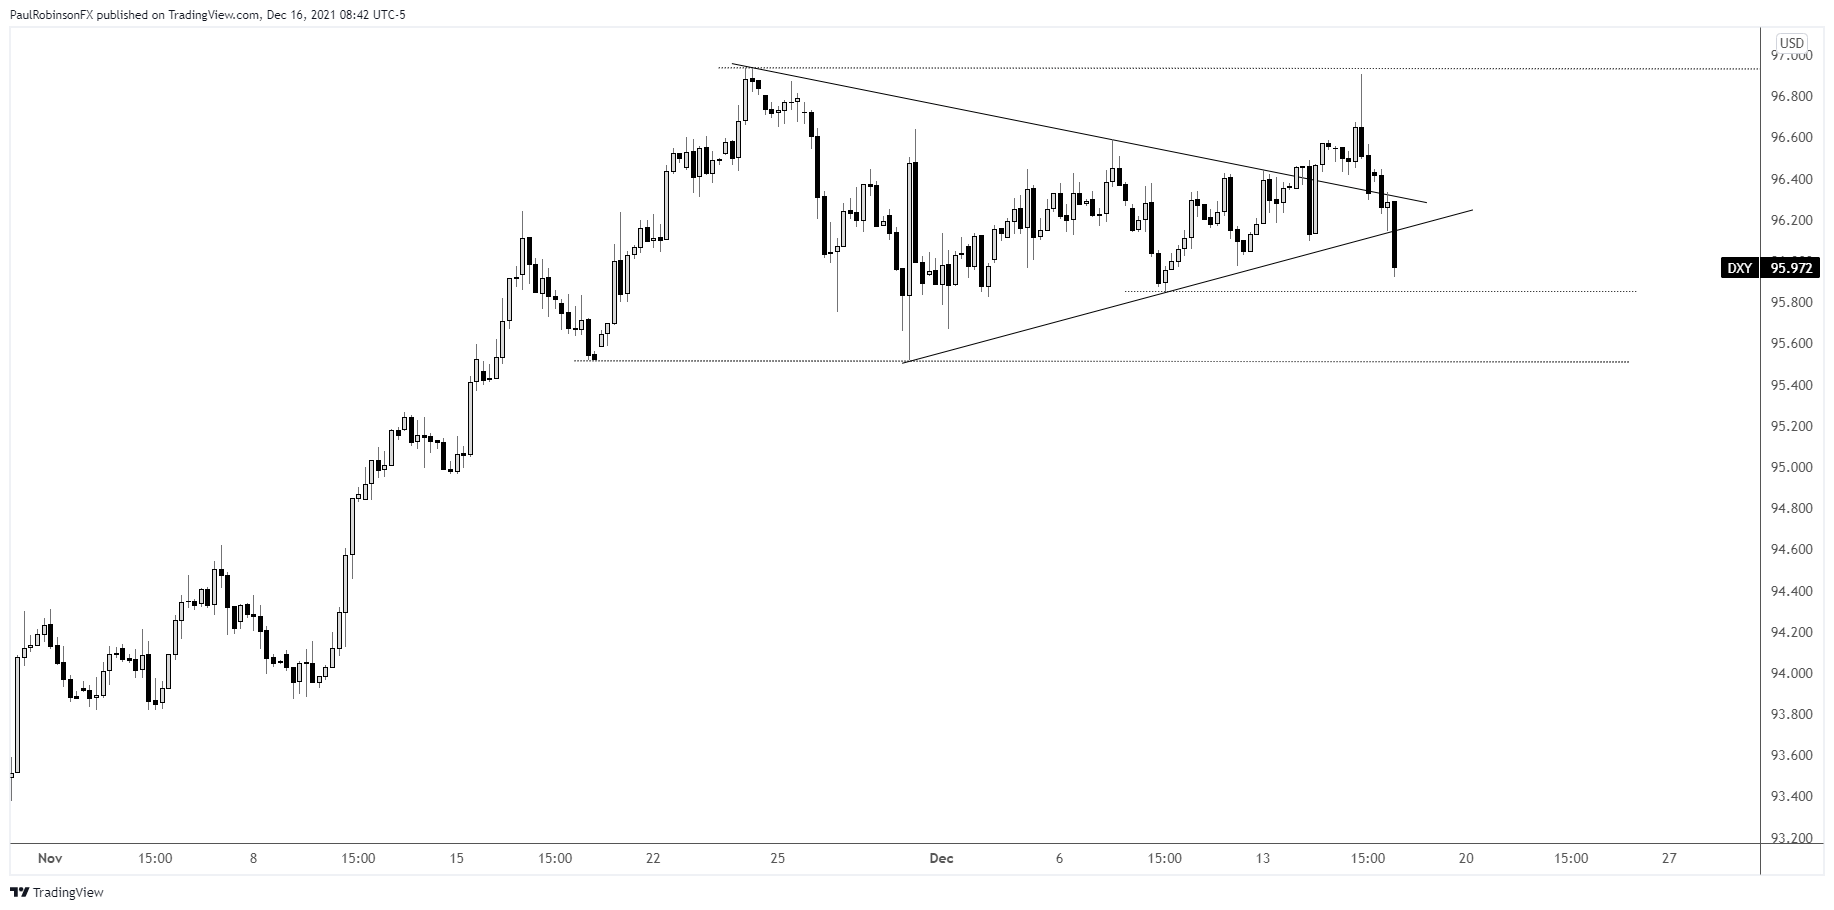
The US Dollar Index (DXY) coiled up tightly from November 24 until yesterday, a USD theme that has been discussed regularly the past few days. The confluence between the apex of the triangle and CB activity, starting with the FOMC yesterday, made for an interesting confluence.
The spike higher and reversal candle from the top of the formation is finding more momentum on the downside today with the help of strength out of GBP and EUR on CB policy meetings. Today’s decline has the ability to bring a bearish trigger by declining below the lower trend-line of the triangle formation.
These fake-out breakout type scenarios can be powerful in their own right due the crowd getting trapped on the wrong side, but helping cement this is as the case this time around is the fact that the bottom trend-line of the wedge is also strong slope support running up from June. If that breaks, not just a pattern triggers, but significant support breaks as well.
A close below 95.84 will mark an important lower-low in the near-term as well that will further confirm any breakdown we may see here today, tomorrow. The first meaningful level of support to watch is the triangle low at 95.51, but if the fake-out is to hold its weight then we are likely to see lower levels than that.
The next big level of support doesn’t arrive until down around 94.67, a level that began with the March 2020 low (an important one). It could very well be in confluence with the trend-line rising up from May, so if we reach that point it is likely that support holds, initially.
Before getting too bearish, though, it is preferable to see a solid daily closing candle that ends near or at the lows of the day and below the line of support mentioned above. If we see a reversal today that puts the DXY back above support and leaves a candle with a relatively long wick, then the bearish outlook will cool until we do see a confirmed breakdown.

US Dollar Index (DXY) Daily Chart
US Dollar Index (DXY) 4-hr Chart
Resources for Forex Traders
Whether you are a new or experienced trader, we have several resources available to help you; indicator for tracking trader sentiment, quarterly trading forecasts, analytical and educational webinars held daily, trading guides to help you improve trading performance, and one specifically for those who are new to forex.
---Written by Paul Robinson, Market Analyst
You can follow Paul on Twitter at @PaulRobinsonFX


