


US Dollar Technical Outlook
- DXY walking the line on slope support from June
- Still looking for a reason to move off the line

US Dollar Technical Outlook: DXY Tightropes Support, Looks for Catalyst
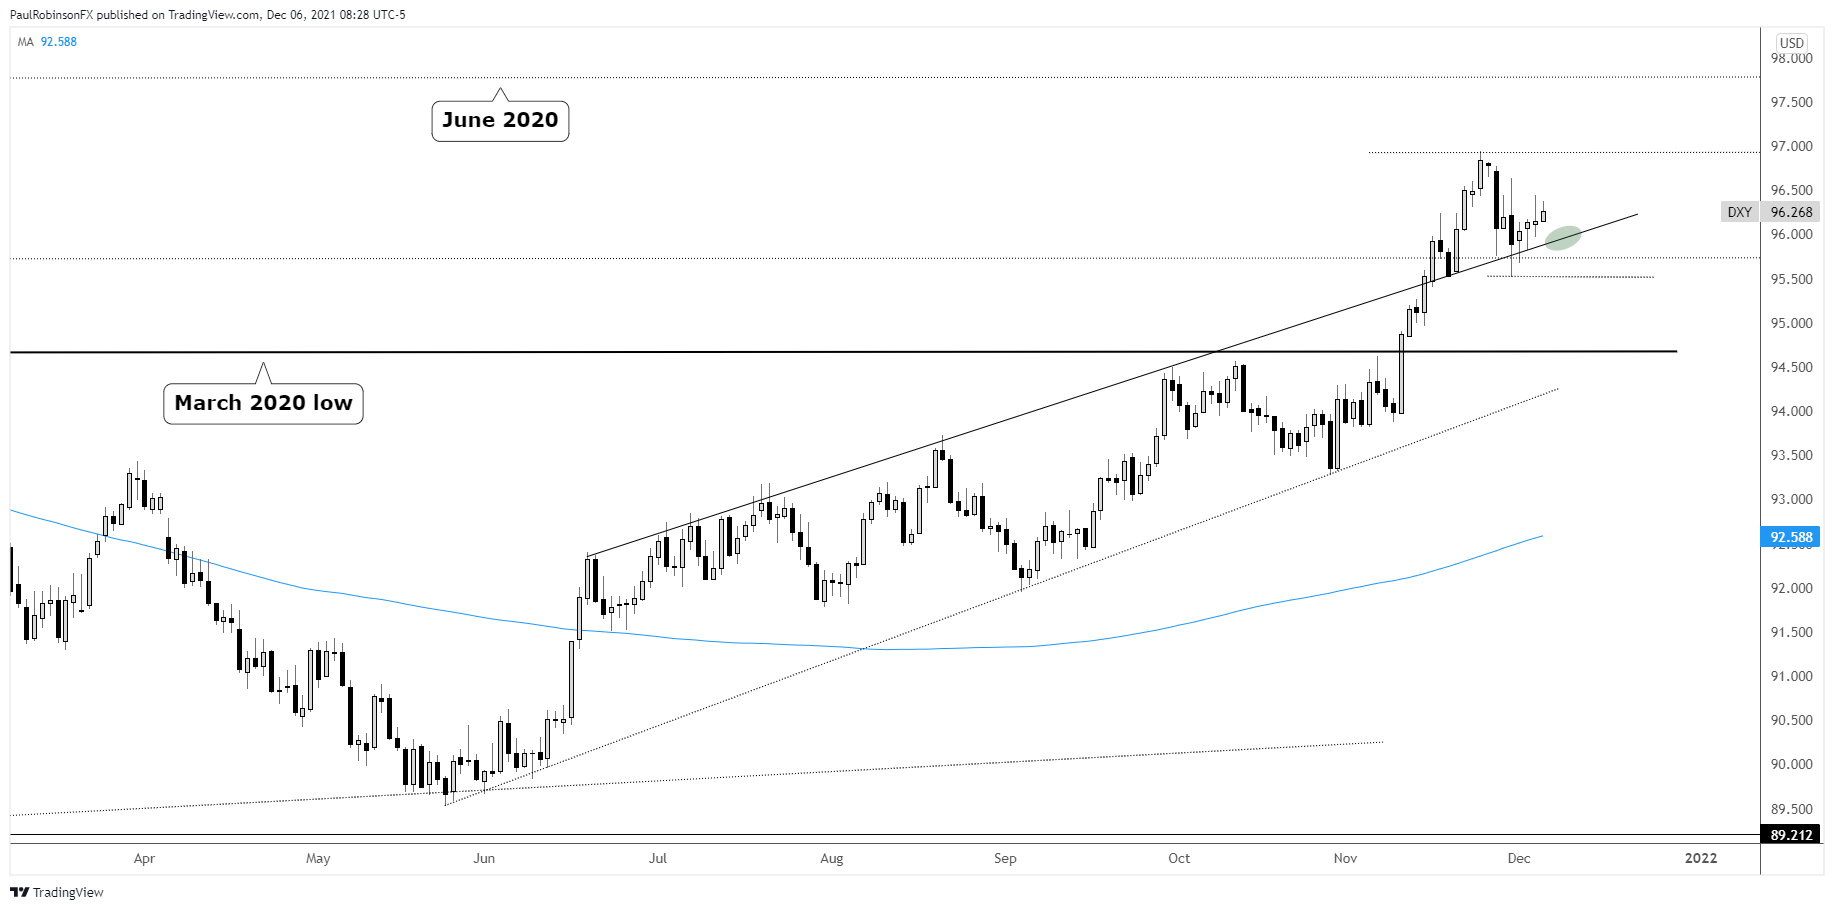
The US Dollar Index (DXY) is sitting on an important slope that dates to June, still looking for a reason to move higher off the line or break down through it. What the catalyst may be is anyone’s guess, but we should soon see something develop as the dollar meanders sideways.
The slope is an important one, running higher over highs in June, July, August, and September. It was broken as resistance last month and is now being held as support. The grind sideways on the line should come to an end relatively soon, but then again it could take some time as the year draws to an end.
Giving the trend and support the benefit of the doubt, probability may favor the next move taking shape on the top-side. If this is the case, then the first level to watch is the November high at 96.93. A breakout above there will have the June 2020 high at 97.80 in play. It’s not a highly meaningful level of resistance, but could nevertheless create a bump in the road.
On the downside, a close below the multi-month slope may be enough to get things rolling downhill. However, a break below the slope and the November 30 low at 95.51 is seen as being the point of validation for a breakdown. In the event we see this occur, then the big level (~94.67) running over from the March 2020 low that kept price action in check through October into November will be targeted as the next level of support.
It is possible the DXY goes nowhere for a bit and finds itself chopping sideways through the end of the year, in which case the above mentioned levels might not get breached to validate a move in either direction. If this is the case, then being patient and doing nothing could be the best play. Those looking to trade ranges may want to lean on support/resistance for fade trades.

US Dollar Index (DXY) Daily Chart
Resources for Forex Traders
Whether you are a new or experienced trader, we have several resources available to help you; indicator for tracking trader sentiment, quarterly trading forecasts, analytical and educational webinars held daily, trading guides to help you improve trading performance, and one specifically for those who are new to forex.
---Written by Paul Robinson, Market Analyst
You can follow Paul on Twitter at @PaulRobinsonFX


