


US Dollar Outlook:
- The US Dollar (via the DXY Index) has been flagging in October, surviving a crucial test this week by finding support at its daily 21-EMA.
- Eurodollar spreads and the US Treasury yield curve continue to suggest a more hawkish Fed is coming, keeping intact the bullish fundamental argument.
- The IG Client Sentiment Index suggests that USD/JPY has a bullish bias in the near-term.

US Dollar Rebounds, Bull Flag Holds
The US Dollar (via the DXY Index) touched a fresh yearly high earlier this week, but a round of profit taking soon emerged, helping the DXY Index continue to carve out a clear bull flag through October thus far. But the fundamental narrative has not changed: inflation persisting at higher levels longer than anticipated by the Federal Reserve has increased the likelihood that tapering will soon begin, leaving the greenback with a more favorable central bank backdrop than either of its major counterparts, the Euro or the Japanese Yen.
Hawkish Fed Still Expected After US CPI, FOMC Minutes
We can measure whether a Fed rate hike is being priced-in using Eurodollar contracts by examining the difference in borrowing costs for commercial banks over a specific time horizon in the future. Chart 1 below showcases the difference in borrowing costs – the spread – for the October 2021 and December 2023 contracts, in order to gauge where interest rates are headed by December 2023.
Eurodollar Futures Contract Spread (October 2021-DECEMBER 2023) [BLUE], US 2s5s10s Butterfly [ORANGE], DXY Index [RED]: 4-hour Chart (April 2021 to October 2021) (Chart1)
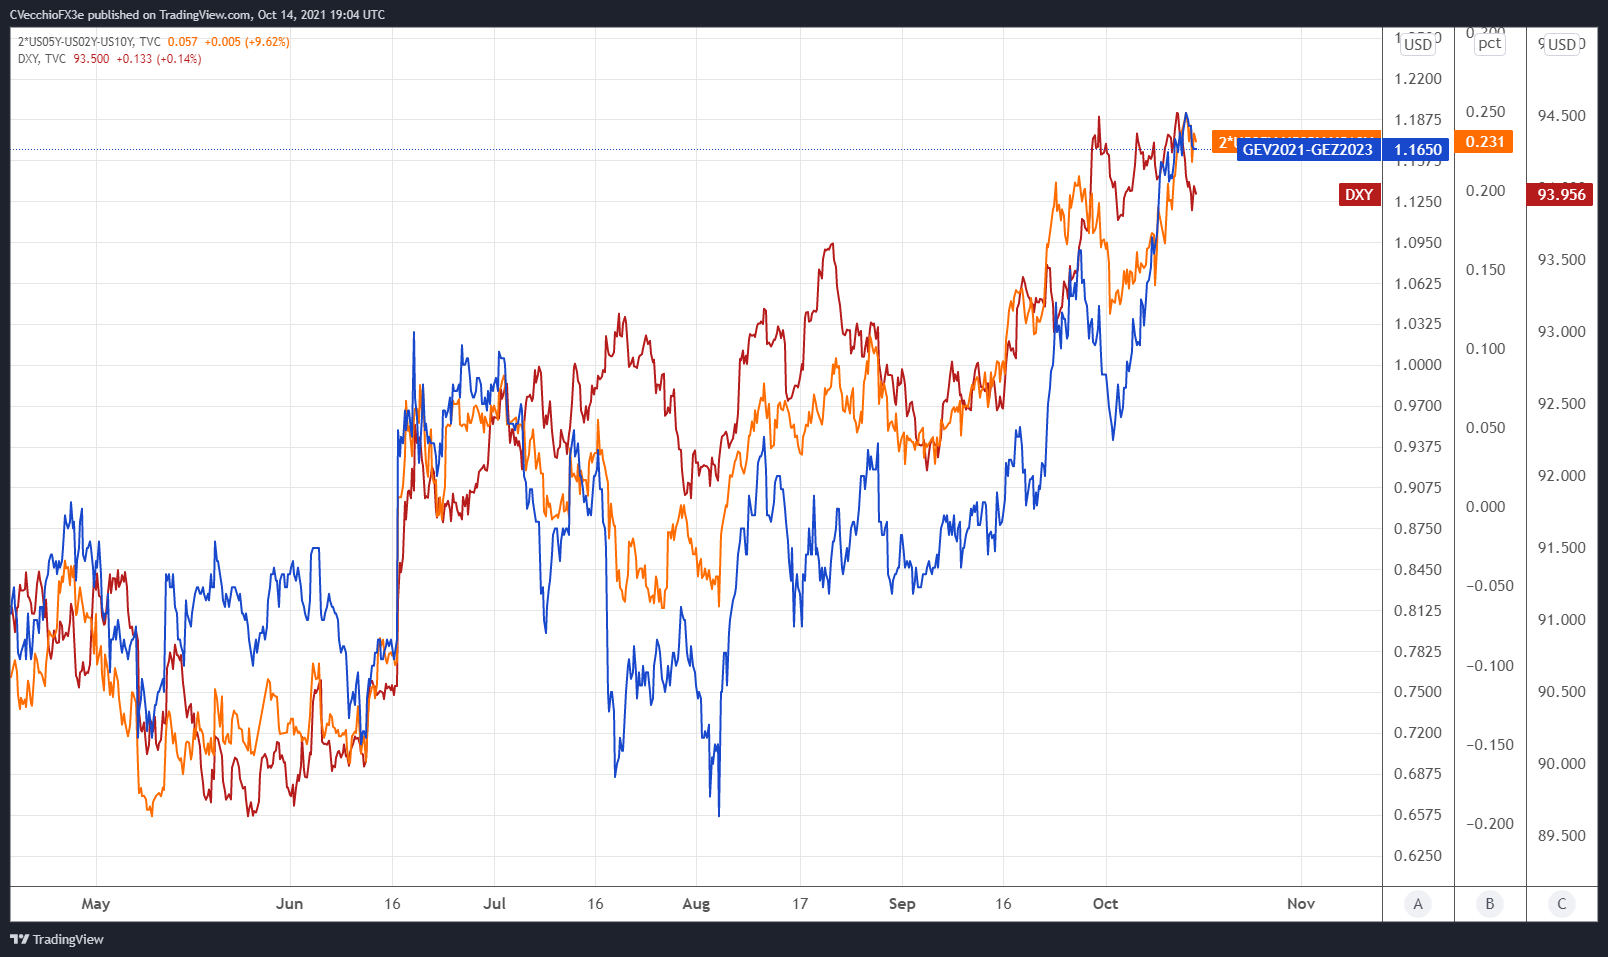
By comparing Fed rate hike odds with the US Treasury 2s5s10s butterfly, we can gauge whether or not the bond market is acting in a manner consistent with what occurred in 2013/2014 when the Fed signaled its intention to taper its QE program. The 2s5s10s butterfly measures non-parallel shifts in the US yield curve, and if history is accurate, this means that intermediate rates should rise faster than short-end or long-end rates.
As has been the case for several weeks now, continually elevated Eurodollar spreads alongside action in the US yield are consistent with the 2013/2014 period that suggests a more hawkish Fed is soon to arrive; which was also consistent with a stronger US Dollar.
There are 117-bps of rate hikes discounted through the end of 2023 while the 2s5s10s butterfly recently reached its widest spread since the Fed taper talk began in June (and its widest spread of all of 2021). Moreover, consistent with recent chatter from FOMC officials, the first rate hike looks increasingly likely to arrive in late-2022.
DXY PRICE INDEX TECHNICAL ANALYSIS: DAILY CHART (August 2020 to October 2021) (CHART 2)
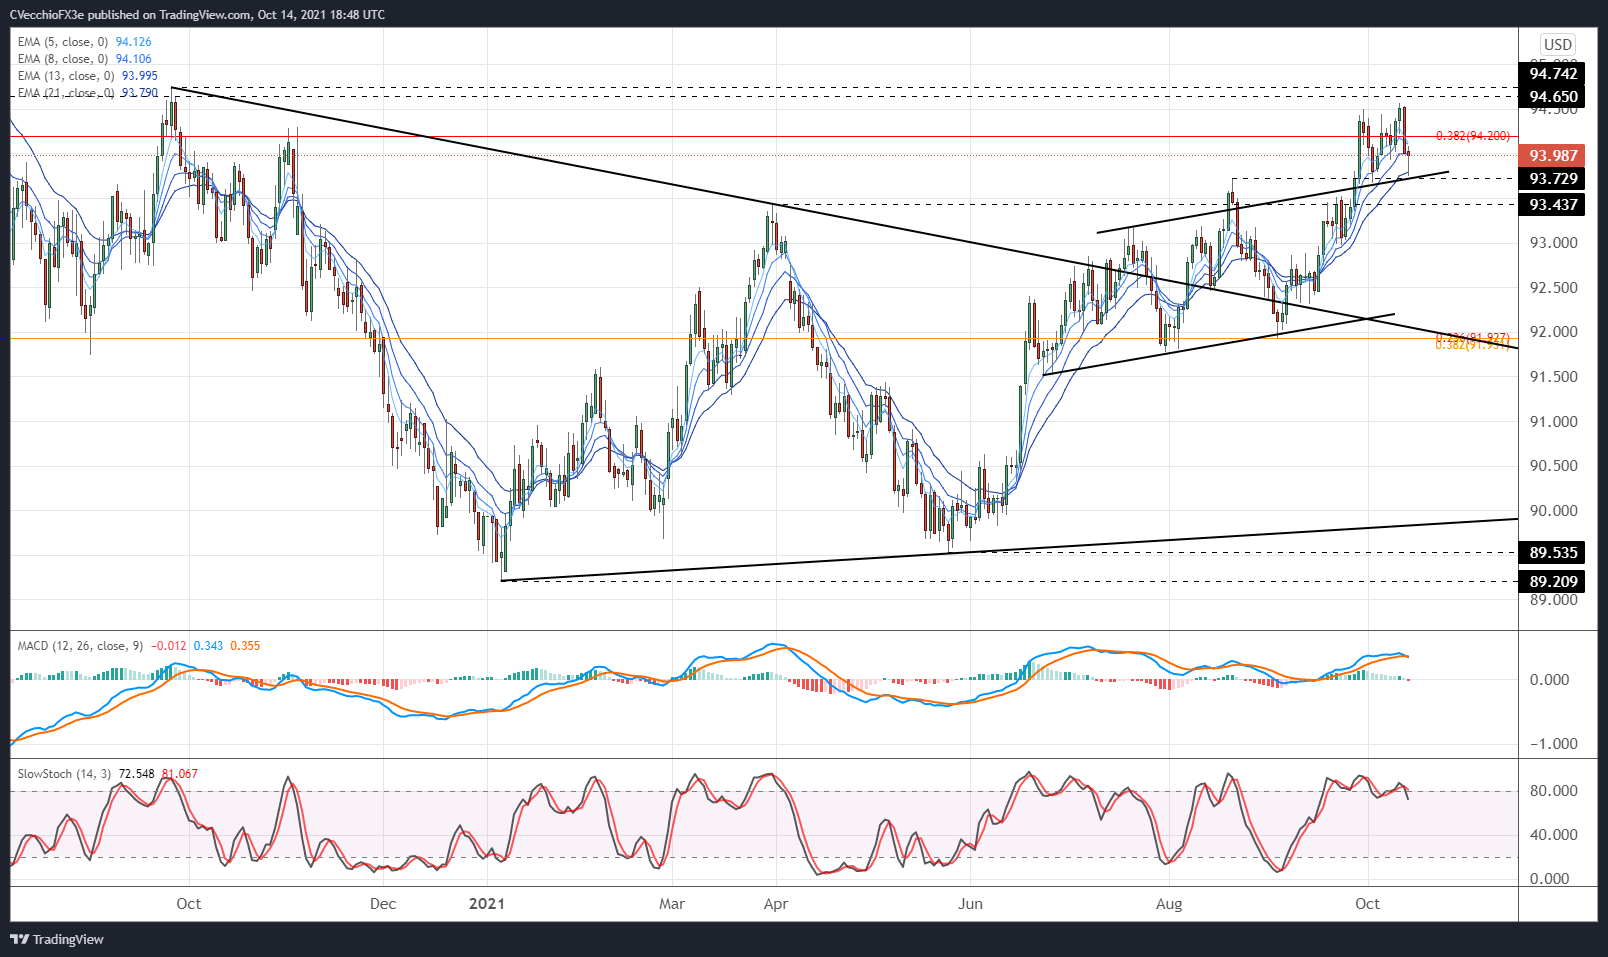
Despite pulling back through the middle of the week, the DXY Index has proved its mettle by finding support at its daily 21-EMA – and in the process, setting a ‘higher low’ above its August high at 93.73. This episode of former resistance proving as support following a bullish breakout suggests that momentum remains firmly to the upside.
Even with the pullback, the DXY Index’s daily 5-, 8-, 13-, and 21-EMA envelope remains in bullish sequential order. Daily MACD is starting to recede, but remains well-above its signal line. Meanwhile, daily Slow Stochastics are straddling overbought territory, further confirming momentum’s bullish inclinations.
While it may be too soon to suggest that the next leg higher is beginning, it would be equally foolish to declare the recent rally extinct.

USD/JPY RATE TECHNICAL ANALYSIS: WEEKLY CHART (July 2011 to October 2021) (CHART 3)
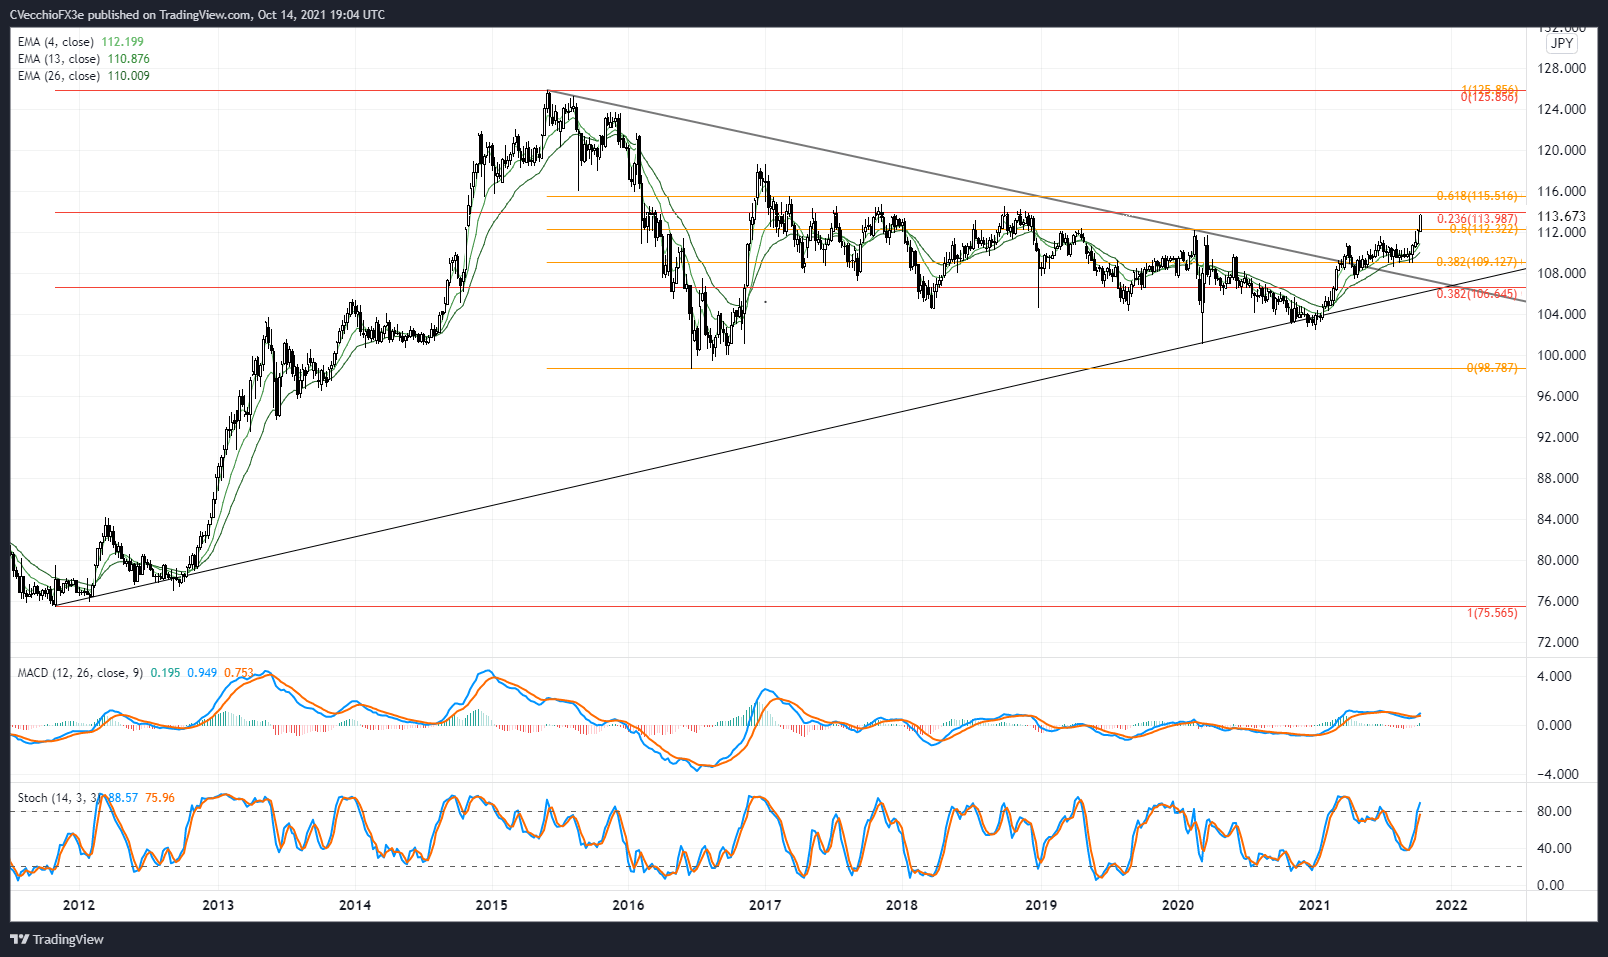
Even as the DXY Index’s rally has paused, USD/JPY rates have continued to surge higher. Looking at USD/JPY from the weekly timeframe, there is a reasonable basis to believe that we’re still in the early innings of a longer-term bullish breakout. USD/JPY rates are above their weekly 4-, 8-, and 13-EMA envelope, which is in bullish sequential order. Weekly MACD has just issued a bullish crossover while above its signal line, and weekly Slow Stochastics have started to return to overbought territory.
Near-term resistance may soon be approaching in the form of the 23.6% Fibonacci retracement of the 2011 low/2015 high range at 113.99, but any pullback from this level henceforth would necessarily be viewed as a ‘buy the dip’ opportunity – especially as US equity markets have started to breakout higher.
IG Client Sentiment Index: USD/JPY RATE Forecast (October 14, 2021) (Chart 4)
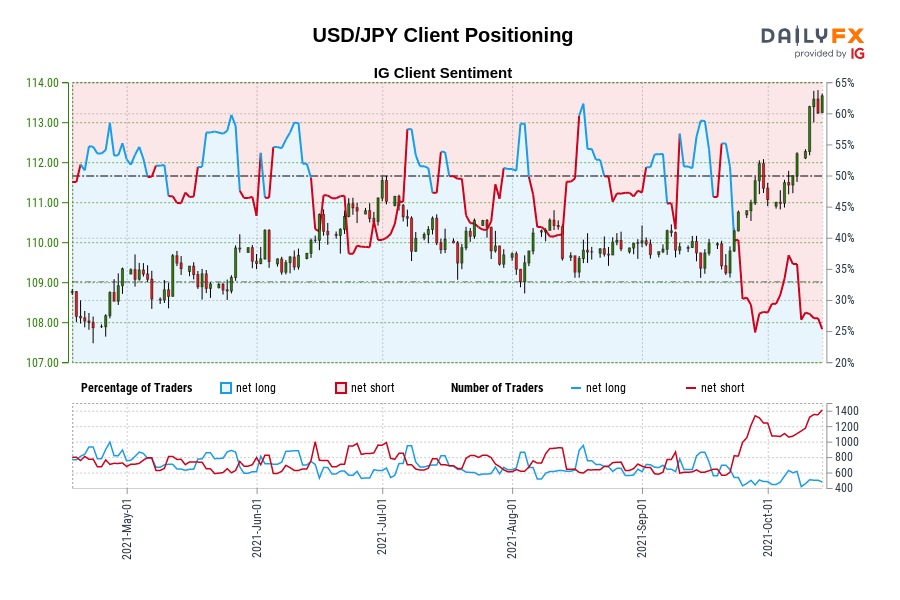
USD/JPY: Retail trader data shows 26.08% of traders are net-long with the ratio of traders short to long at 2.83 to 1. The number of traders net-long is 1.43% higher than yesterday and 19.25% lower from last week, while the number of traders net-short is 2.78% higher than yesterday and 27.31% higher from last week.
We typically take a contrarian view to crowd sentiment, and the fact traders are net-short suggests USD/JPY prices may continue to rise.
Traders are further net-short than yesterday and last week, and the combination of current sentiment and recent changes gives us a stronger USD/JPY-bullish contrarian trading bias.

--- Written by Christopher Vecchio, CFA, Senior Strategist


