


USD Technical Outlook
- US Dollar Index (DXY) breaking down in-line with trend
- Extending towards worst levels since 2018
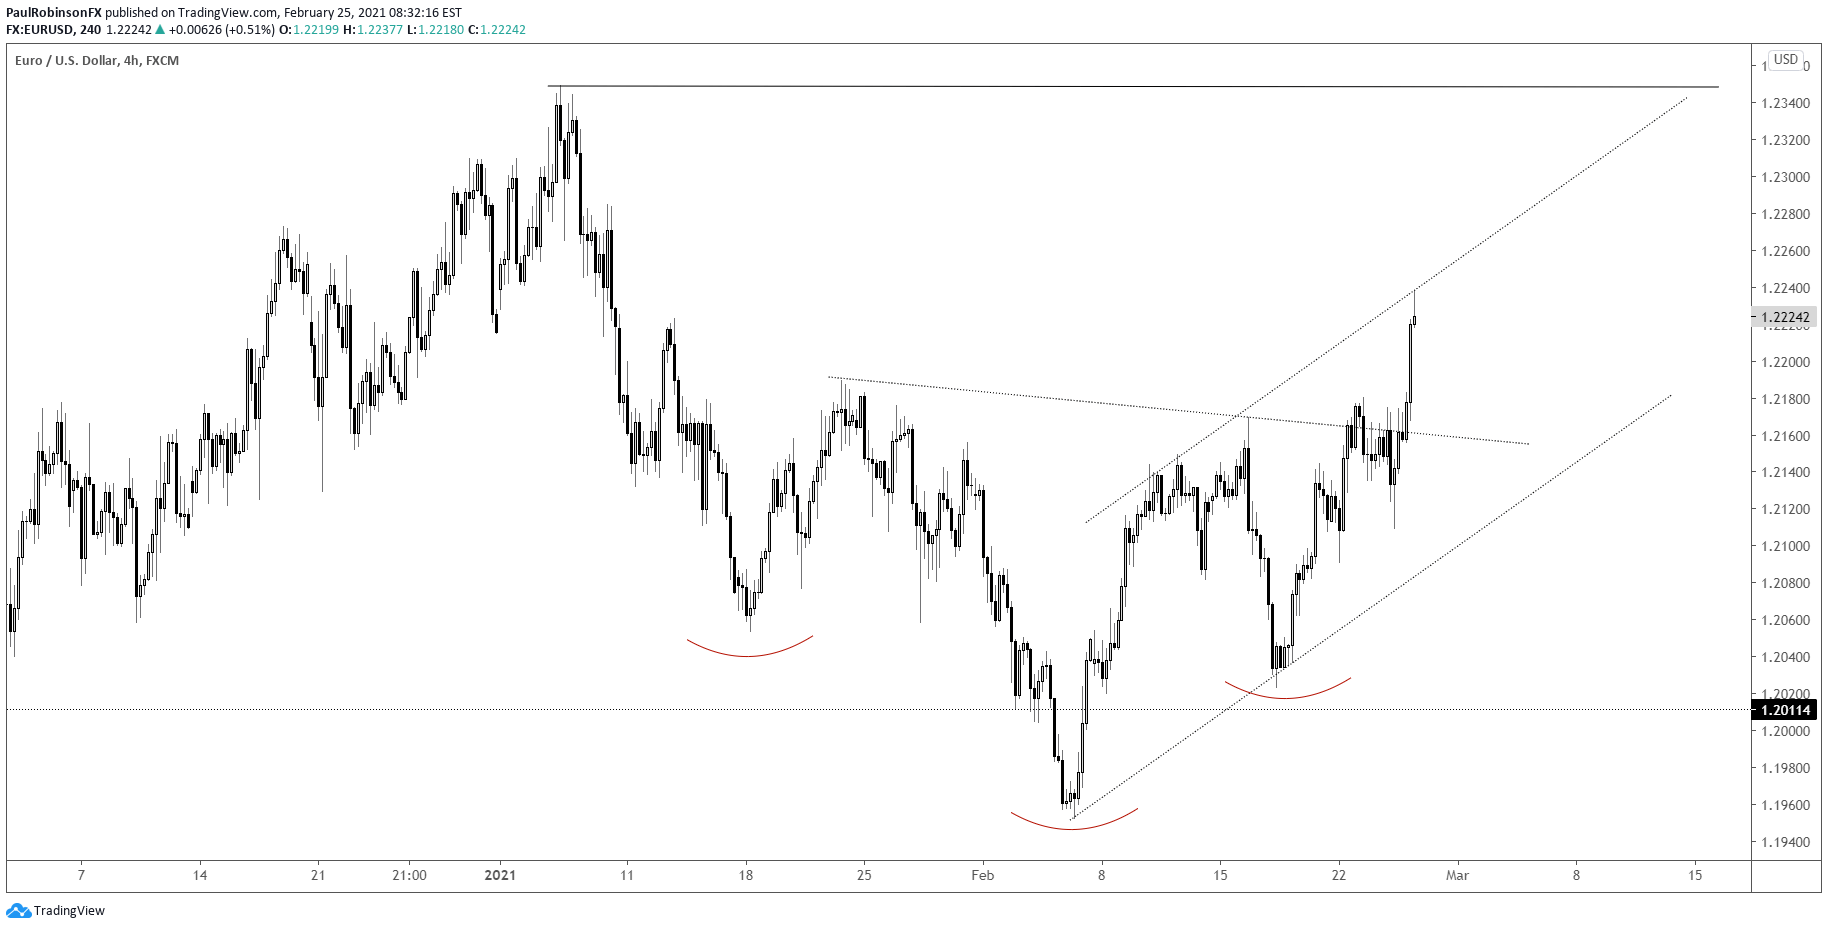
- EUR/USD leading the DXY lower as it rises out of pattern
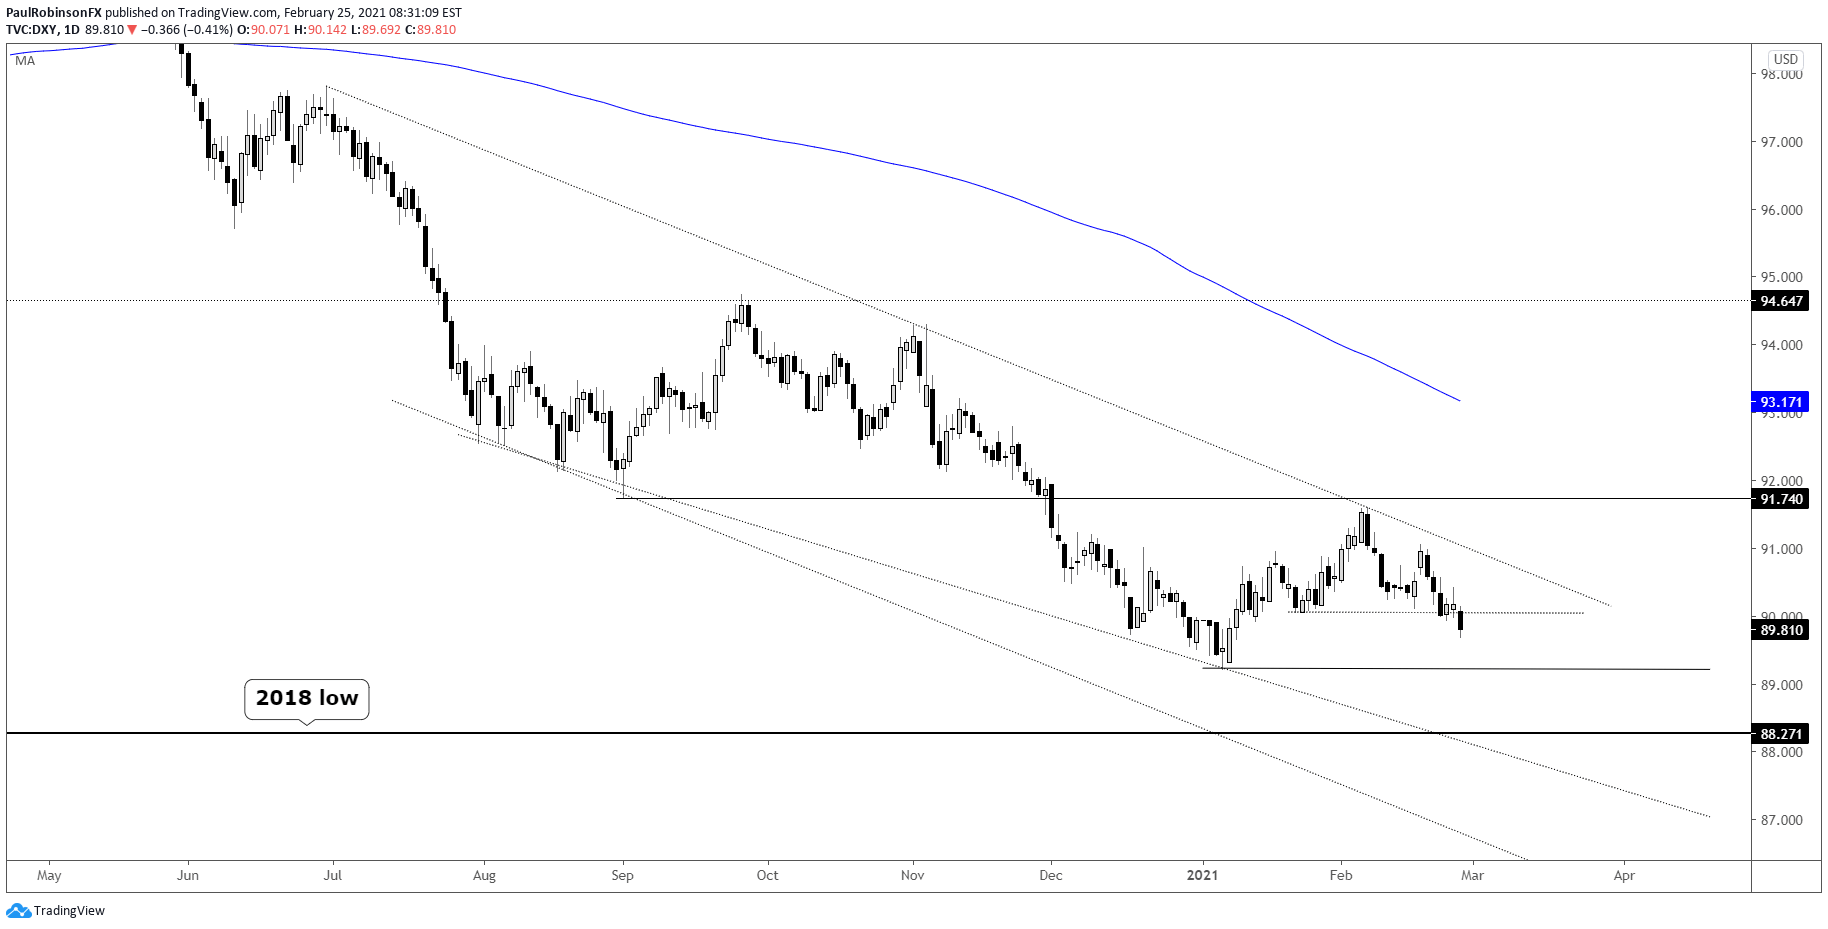
USD eyeing Jan lows, worst since 2018
The U.S. Dollar Index (DXY) is at its worst levels since early Jan, now eyeing the lows of the year and lowest levels since 2018. A breakdown below 89.20 will have important macro levels in play from a few years back.
The low of 2018 was 88.25, a level we could see in the near-term that has potential to have longer-term ramifications. Generally speaking, the dollar hasn’t gone anywhere since 2015, up or down. There have been plenty of strong calls in both directions by keen market observers and participants, but generally neither side has been right as a big range develops.
That could change, though. Or continue. A break below the 2018 low may usher in another wave of selling, while a hold could turn things around for the USD. It would mean we are still in a macro range, but there would be plenty of upside for the DXY to rise before reaching the top of the range near 104.
For now, the focus is on how price action behaves at the Jan low of 89.20, and from there the 88.25 2018 low. Should we see the DXY reject at support, it could lead to a bounce. But there is some work to be done to turn the picture bullish for the index.

US Dollar Index (DXY) Daily Chart (trading bias is negative)
EUR/USD is 57% of the DXY, and as such it is the leader. With it rising out of an inverse head-and-shoulders pattern (DXY is doing similar in reverse), the high at 12349 is in view. For short-term trades, the channel developing off the monthly low could be a good guide. Stay above the lower parallel and the trend is higher, break below and the outlook turns neutral at the least. On the top-side the 2018 high is 12555, a big level as is the 88.25 DXY level.
EUR/USD 4-hr Chart (eyeing 12349)
Resources for Forex Traders
Whether you are a new or experienced trader, we have several resources available to help you; indicator for tracking trader sentiment, quarterly trading forecasts, analytical and educational webinars held daily, trading guides to help you improve trading performance, and one specifically for those who are new to forex.
---Written by Paul Robinson, Market Analyst
You can follow Paul on Twitter at @PaulRobinsonFX


