


USD Technical Outlook
- US Dollar Index (DXY) turning up from bottoming sequence
- March trend-line, September low will be first tests to watch
- EUR/USD, GBP/USD, USD/JPY, USD/CAD charts to watch
US Dollar working on turning the corner
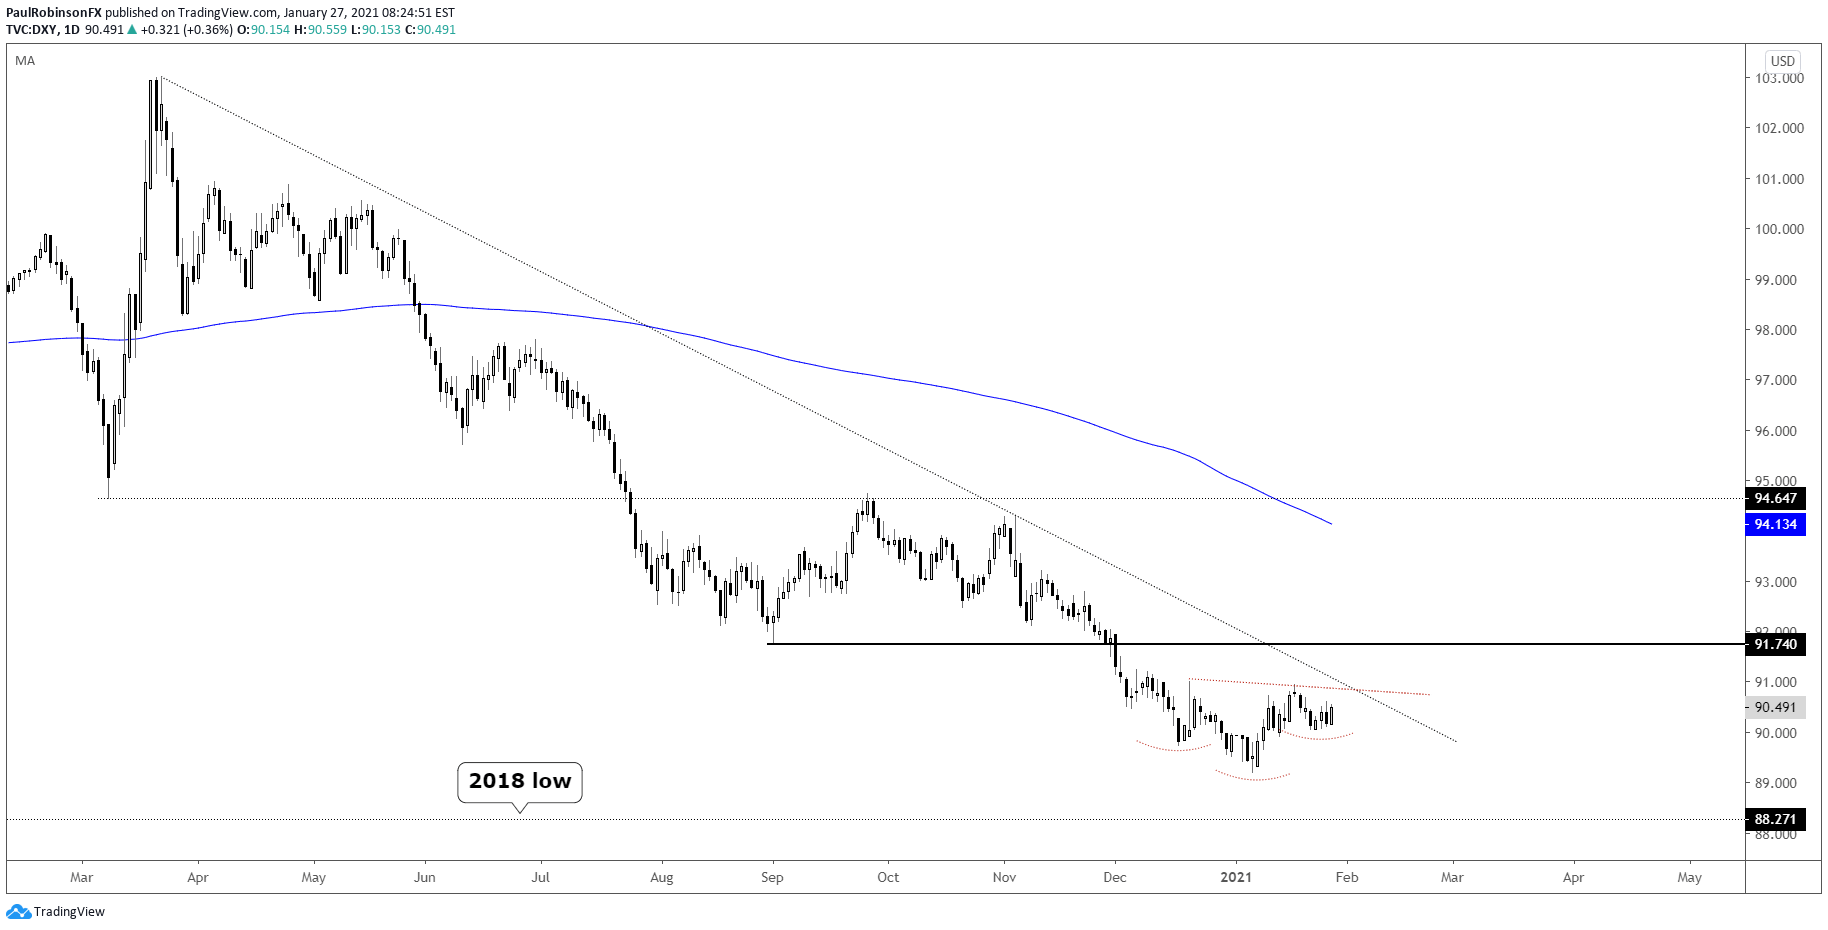
The US Dollar Index (DXY) is in the process of turning higher, representing what may potentially amount to a broad USD rally. The index in the short-term is working on an inverse head-and-shoulders pattern that could soon have the March trend-line in focus if the neckline is broken.
In the event the pattern is triggered and the March trend-line is breached, the next level of significant resistance to watch will be the September low at 91.74. Both of these medium-term thresholds have significant importance to the outcome on a boost higher from here.
Should the head-and-shoulders fail to trigger above the neckline and rollover towards a break of 90.05, then look for a potential continuation in the downward trend towards the 2018 low at 88.27.
At the immediate moment, the upside is looking increasingly favorable, but we can’t rule out a pattern failure. With that in mind, waiting for confirmation will be key.
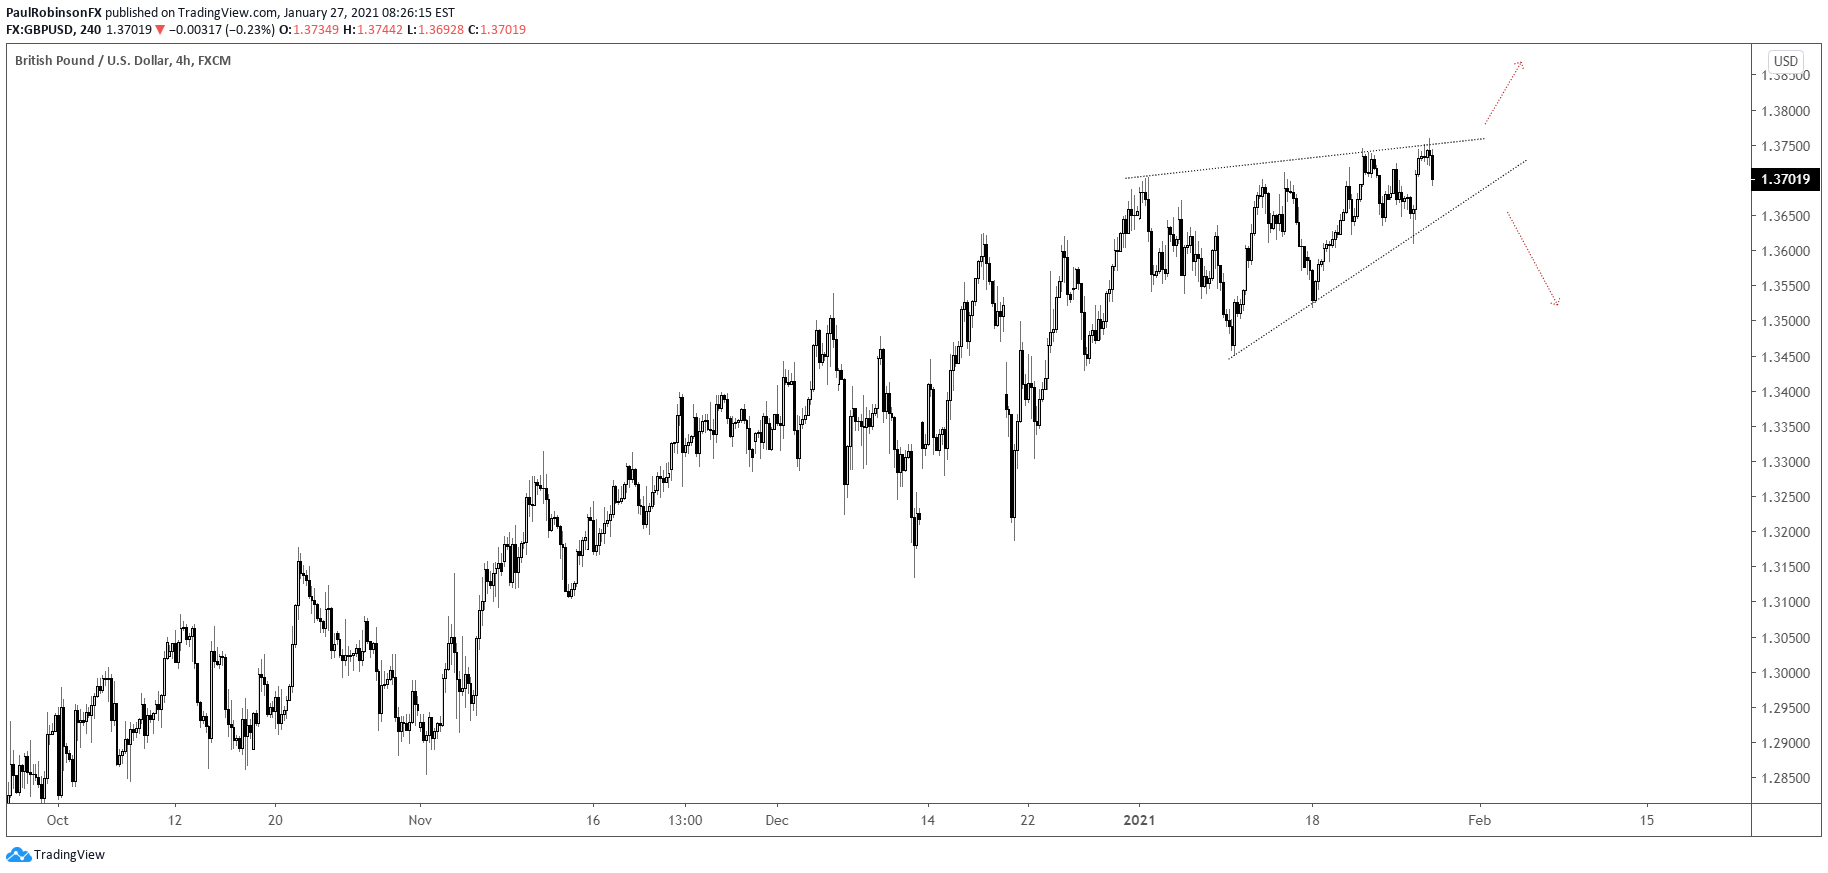
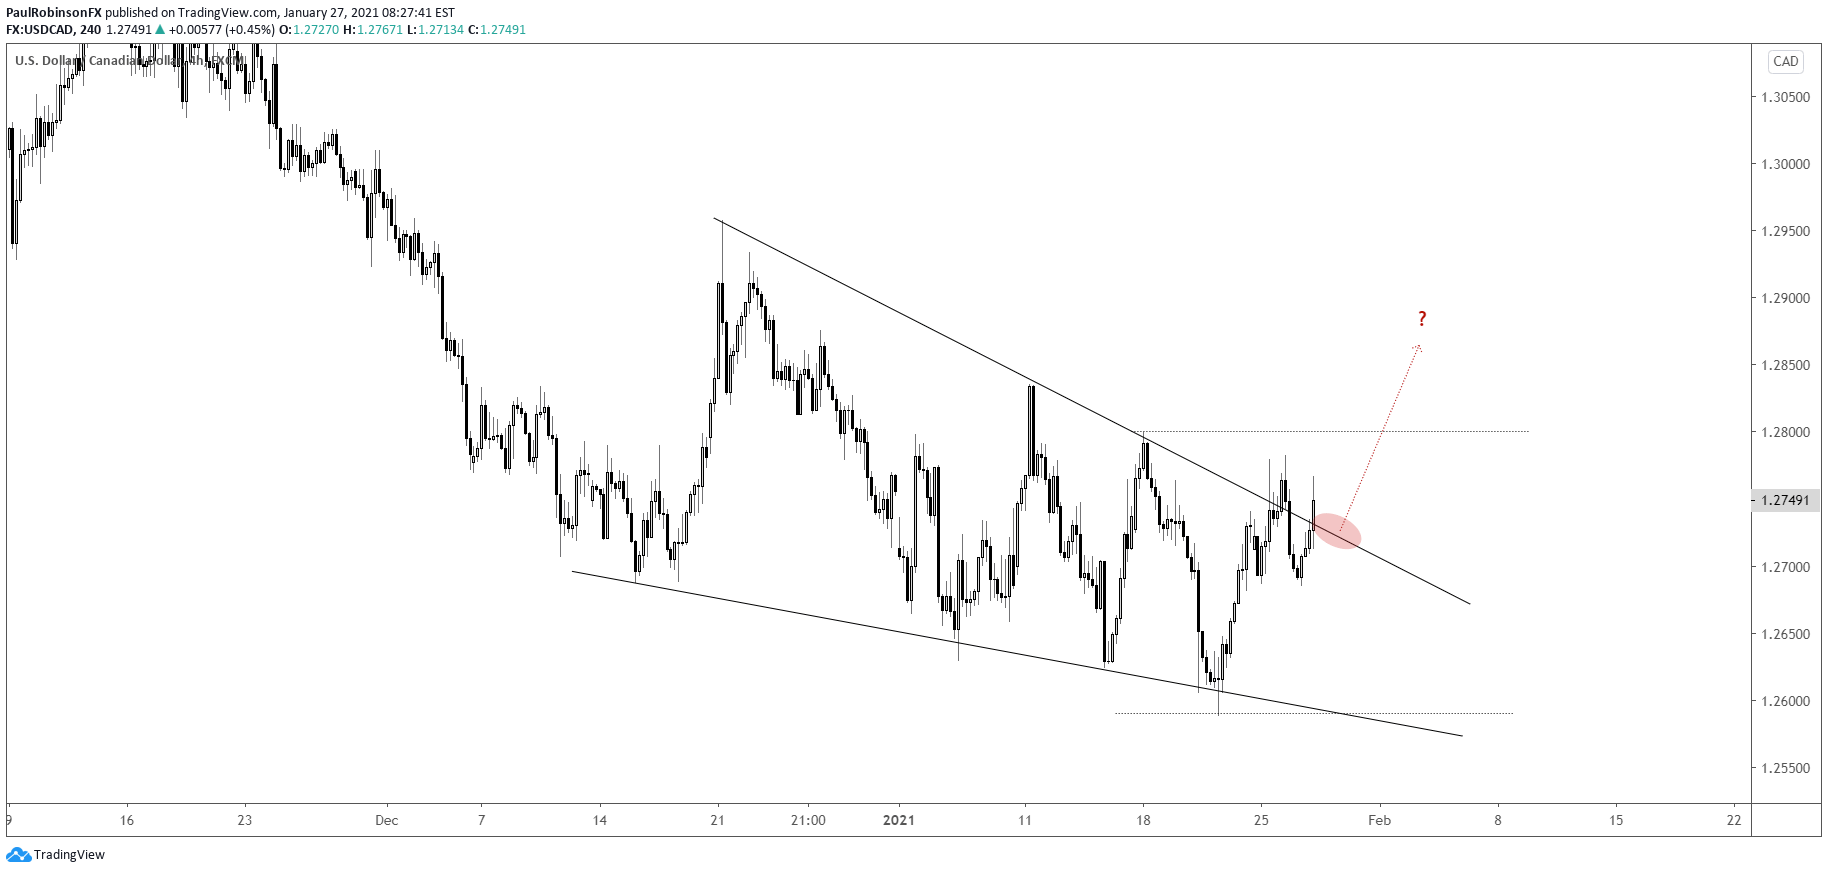
Turning to a few key USD charts; EUR/USD is looking nearly opposite the DXY (EUR = 57.6% of DXY), GBP/USD is posting a rising wedge that could soon trigger, USD/JPY channel is about to break, and USD/CAD is trying to break a falling wedge.

US Dollar Index (DXY) Daily Chart (inverse H&S, top-side resistance to watch)
EUR/USD 4-hr Chart

GBP/USD 4-hr Chart
GBP/USD Chart by TradingView
USD/JPY 4-hr Chart

USD/CAD 4-hr Chart
Resources for Forex Traders
Whether you are a new or experienced trader, we have several resources available to help you; indicator for tracking trader sentiment, quarterly trading forecasts, analytical and educational webinars held daily, trading guides to help you improve trading performance, and one specifically for those who are new to forex.
---Written by Paul Robinson, Market Analyst
You can follow Paul on Twitter at @PaulRobinsonFX


