


US Dollar Technical Outlook:
- DXY coming off long-term support again
- Needs to hold the current rally without a quick reversal
The US Dollar Index (DXY) is again coming off big support via a horizontal level that has come in and out of play over the years (since ’98) around the 92 line and a trend-line from 2011. The confluence between the two thresholds has made this an important time for the dollar from a technical standpoint.
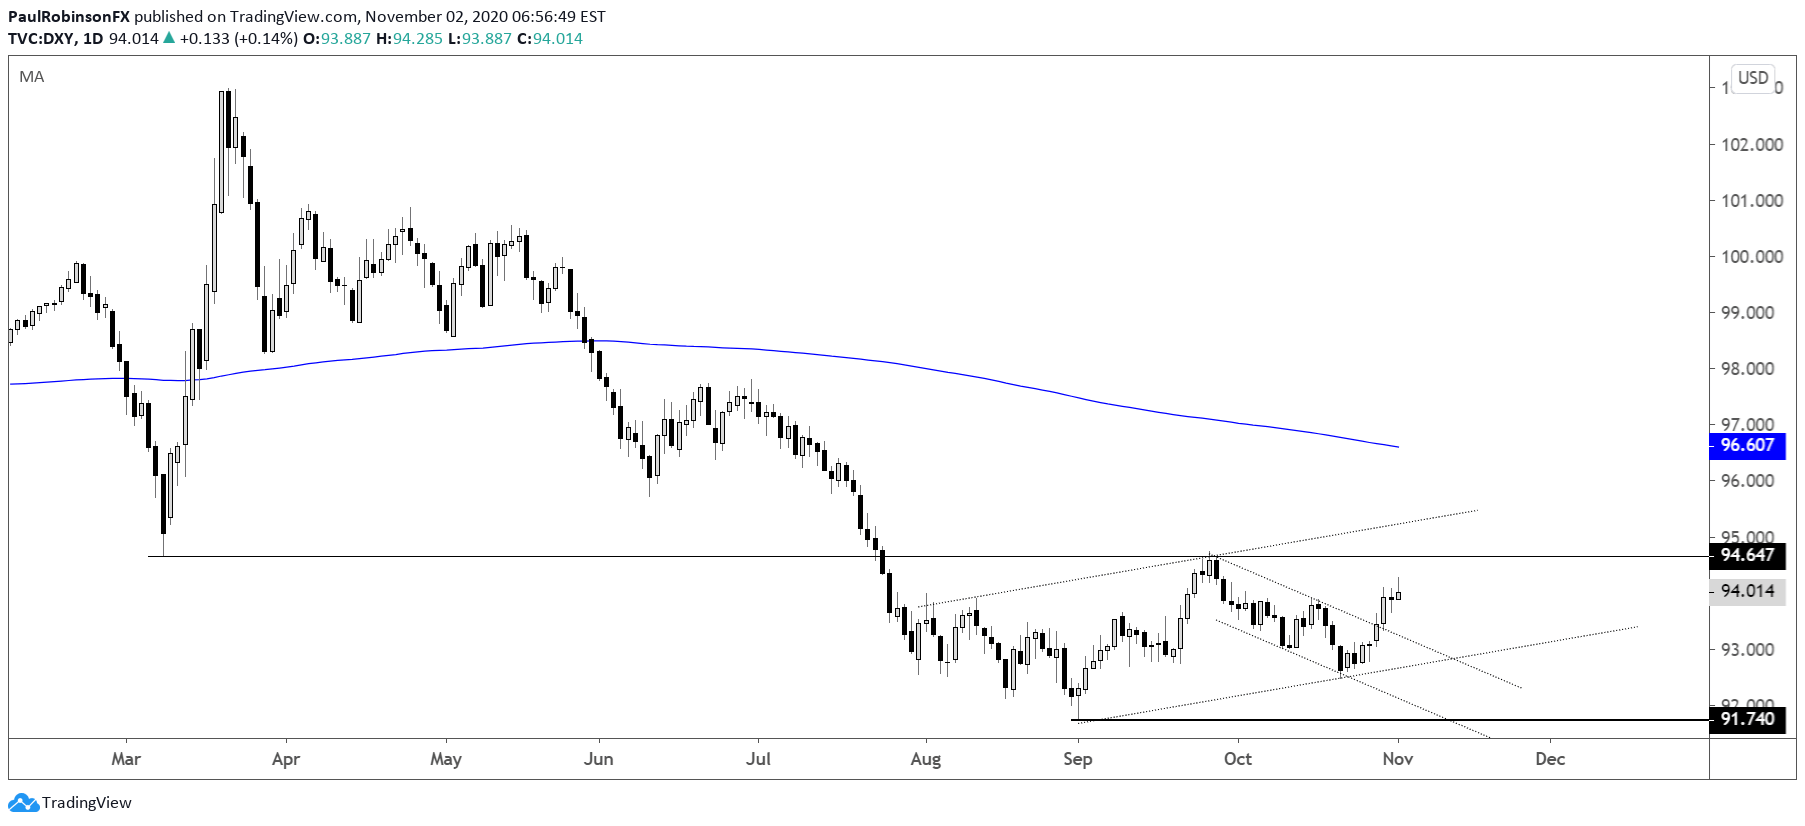
The rally we have seen so far hasn’t been an explosive burst, but that doesn’t mean the DXY can’t continue to climb as is or even see an acceleration as the market gains confidence. The big obstacle at the moment is the March low, September high around 94.64.
It needs to be hurdled to get things rolling the right way. A smallish pullback and/or congestion pattern right around current levels could do the index some good. A higher low from the October low would help solidify a developing uptrend.
On the flip-side, if we see the USD index fold and pick up some momentum in doing so, then it could quickly find itself in another fight with support. It is indeed a big area as a breakdown is likely to lead to a quick drive lower to the 2018 low at 88.25.
For now, with the backdrop of support and general short-term price action, it appears prudent to consider that the DXY may be looking to extend a rally, but caution is warranted as there is still some work to be done.
The U.S. presidential election is tomorrow, and on that there could be some big swings in markets – traders will want to be vigilant during the period from tomorrow into Wednesday when the bulk of the election-related volatility is likely to be seen.

US Dollar Index (DXY) Daily Chart (trying to lift from support)
US Dollar Index (DXY) Weekly Chart (Big Long-term Support)

U.S. Dollar Currency Index (DXY) Charts by TradingView
Resources for Forex Traders
Whether you are a new or experienced trader, we have several resources available to help you; indicator for tracking trader sentiment, quarterly trading forecasts, analytical and educational webinars held daily, trading guides to help you improve trading performance, and one specifically for those who are new to forex.
---Written by Paul Robinson, Market Analyst
You can follow Paul on Twitter at @PaulRobinsonFX


