


US Dollar (DXY) Highlights:
- US Dollar Index (DXY) heading towards test of significant level
- EUR/USD interesting short-term techs, the bulk of the DXY index
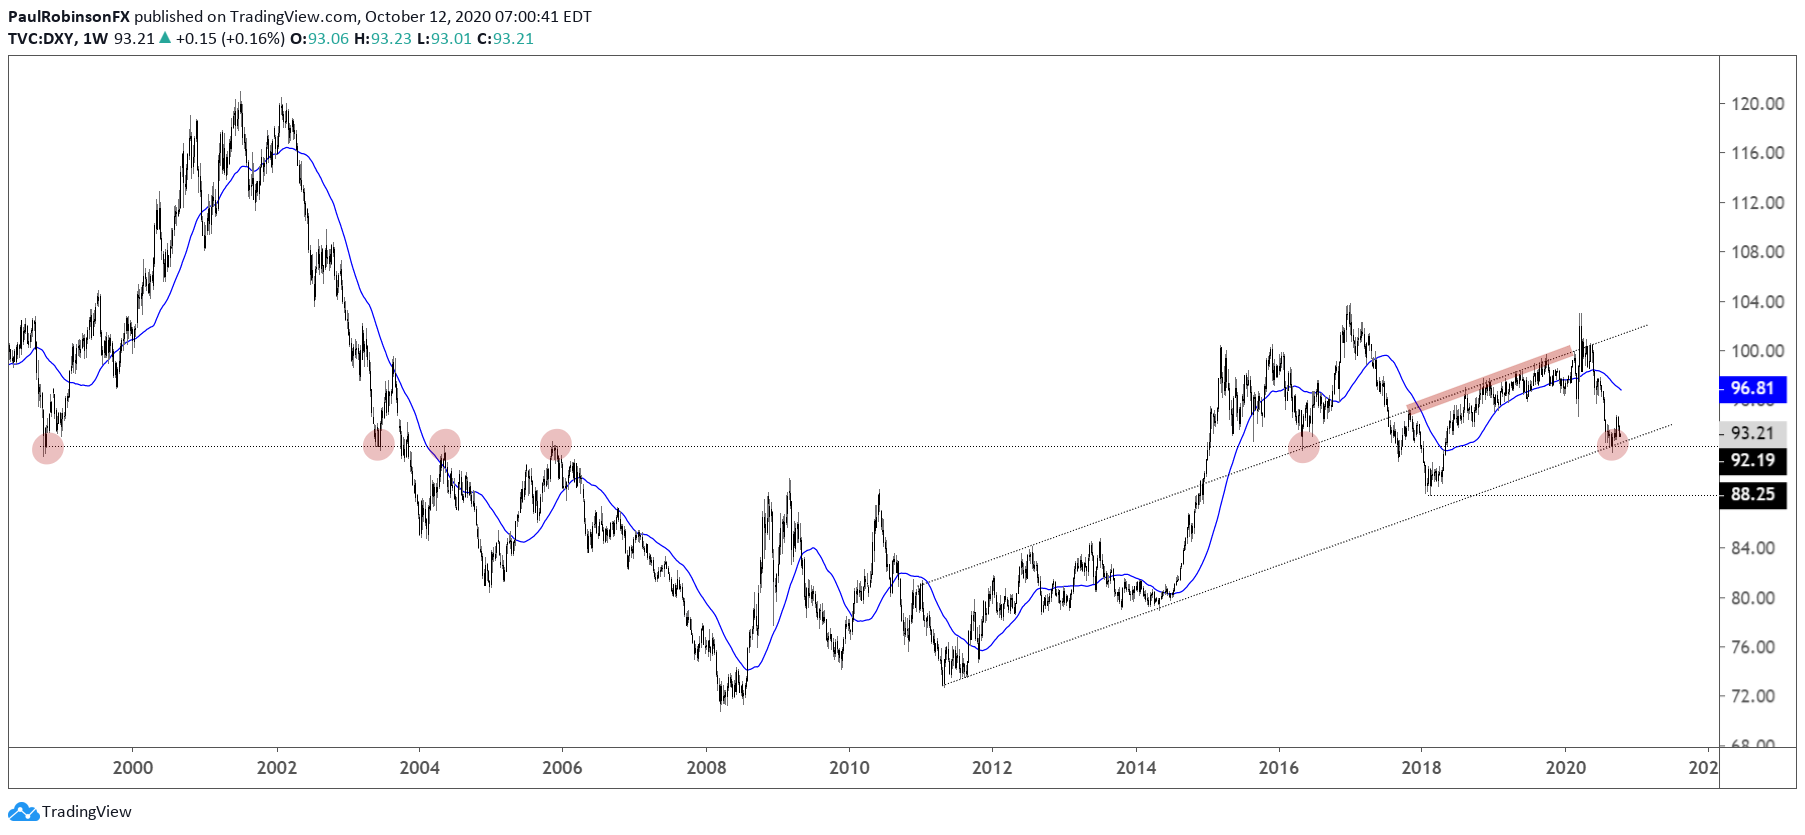
The US Dollar Index (DXY) has been on a two-week run of weakness and is nearing a major long-term level again. There is a trend-line from 2011 (w/ a prominent parallel slope that impacted the past couple of years) and an on-and-off again level that began all the way back in 1998.
The confluent zone of support helped forge at the least a short-term low early in September, but was it only enough to provide temporary strength or was the low more meaningful and long-term in nature? A drop down into the mid-92s will have the DXY thoroughly testing again, with 91.75 as the big make or break level.
A decline below 91.75 is seen as potentially having the 2018 low at 88.25 in play. That would be a sizable leg lower for the Dollar. However, a successful retest could potentially end up as seeing the DXY attempt to make good on the September low as a meaningful turning point.

DXY Weekly Chart (2011/1998 levels in confluence)
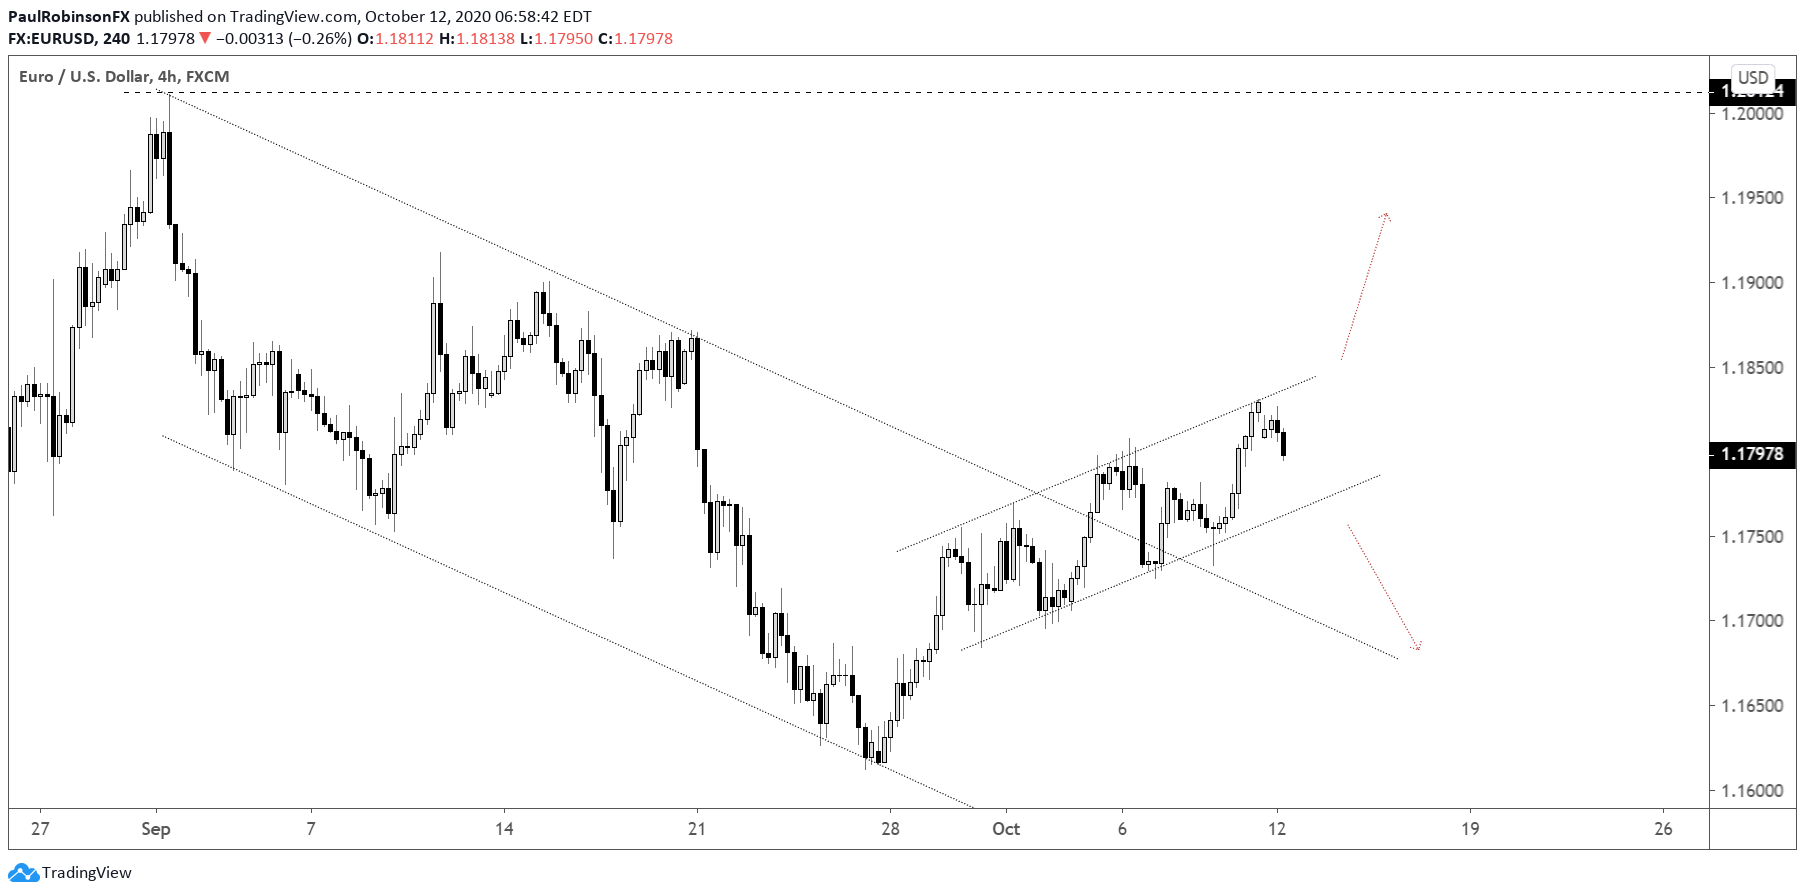
The Euro makes up ~57% of the DXY, and thus it runs the show with how the index moves. In the near-term there is a technical structure on the 4-hr time-frame chart of EUR/USD has potential for helping decide the near-term direction. The channel developing over the past couple of weeks is keeping EUR/USD neatly pointed higher for now. A break outside the channel could either accelerate the move higher and conversely a break below the lower parallel could get price rolling downhill.
The drive higher would put the DXY further into retest territory and potentially lead to a break of the 91.75 level, while a break of the channel will at the least allow the DXY to live to fight another day, and could possibly be the beginning of rounding the corner for a broader move higher.
EUR/USD 4-hr Chart (watching the near-term channel)
Resources for Forex Traders
Whether you are a new or experienced trader, we have several resources available to help you; indicator for tracking trader sentiment, quarterly trading forecasts, analytical and educational webinars held daily, trading guides to help you improve trading performance, and one specifically for those who are new to forex.
---Written by Paul Robinson, Market Analyst
You can follow Paul on Twitter at @PaulRobinsonFX


