


USD Technical Outlook:
• Pulling back from March low, but…
• Good support not too far below
The US Dollar Index (DXY) is pulling off from the March low, an important intermediate-term level given when it developed (during the coronavirus meltdown). This development came after pushing strongly out of an inverse head-and-shoulders (H&S) pattern off long-term support.
This makes the current situation a little tricky. The DXY has big support not too far below, but also has the trend and resistance from the spring working against it. Not too far below current levels are three minor swing highs that were part of the inverse H&S formation, along with the lower parallel of a channel forming off this month’s low. This makes the 94 to 93.50 area an important one for short-term traders.
A test and turn higher off this support zone could put the USD back into the driver’s seat. Clearance above last week’ high at 94.74 (break above the March low) will be needed to confirm this outlook. In this scenario the next level to watch will be the June low at 95.72.
However, if we see price break down below both horizontal and sloping support, it could bring a test of the 1998/2011 confluent level into play. Holding this long-term level is important for the broader outlook.
Right now, on the positioning front, there is a large number of large speculators who are short, which could help keep a floor in the USD, if not accelerate a move higher on the back of short covering.

US Dollar Index (DXY) Daily Chart (support not far below)

U.S. Dollar Currency Index (DXY) Chart by TradingView
US Dollar Index (DXY) Weekly Chart (1998-present, 2011 trend-line)
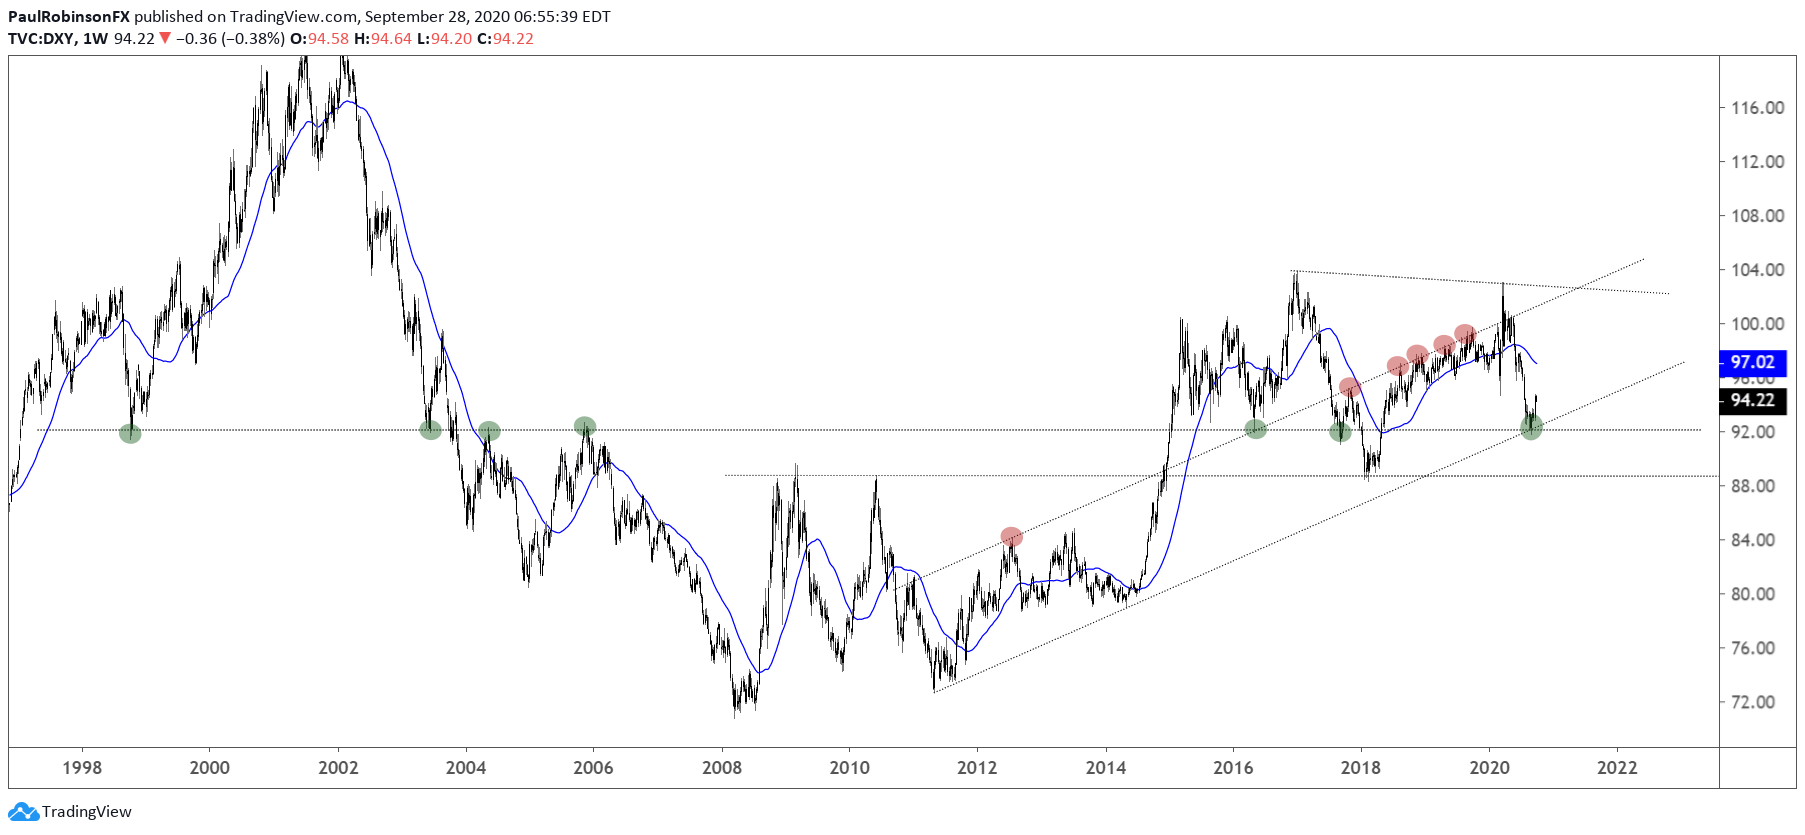
U.S. Dollar Currency Index (DXY) Chart by TradingView
Resources for Forex Traders
Whether you are a new or experienced trader, we have several resources available to help you; indicator for tracking trader sentiment, quarterly trading forecasts, analytical and educational webinars held daily, trading guides to help you improve trading performance, and one specifically for those who are new to forex.
---Written by Paul Robinson, Market Analyst
You can follow Paul on Twitter at @PaulRobinsonFX


