


DXY Highlights:
- US Dollar Index (DXY) losing support from 2011
- Watch to see if a continuation pattern develops
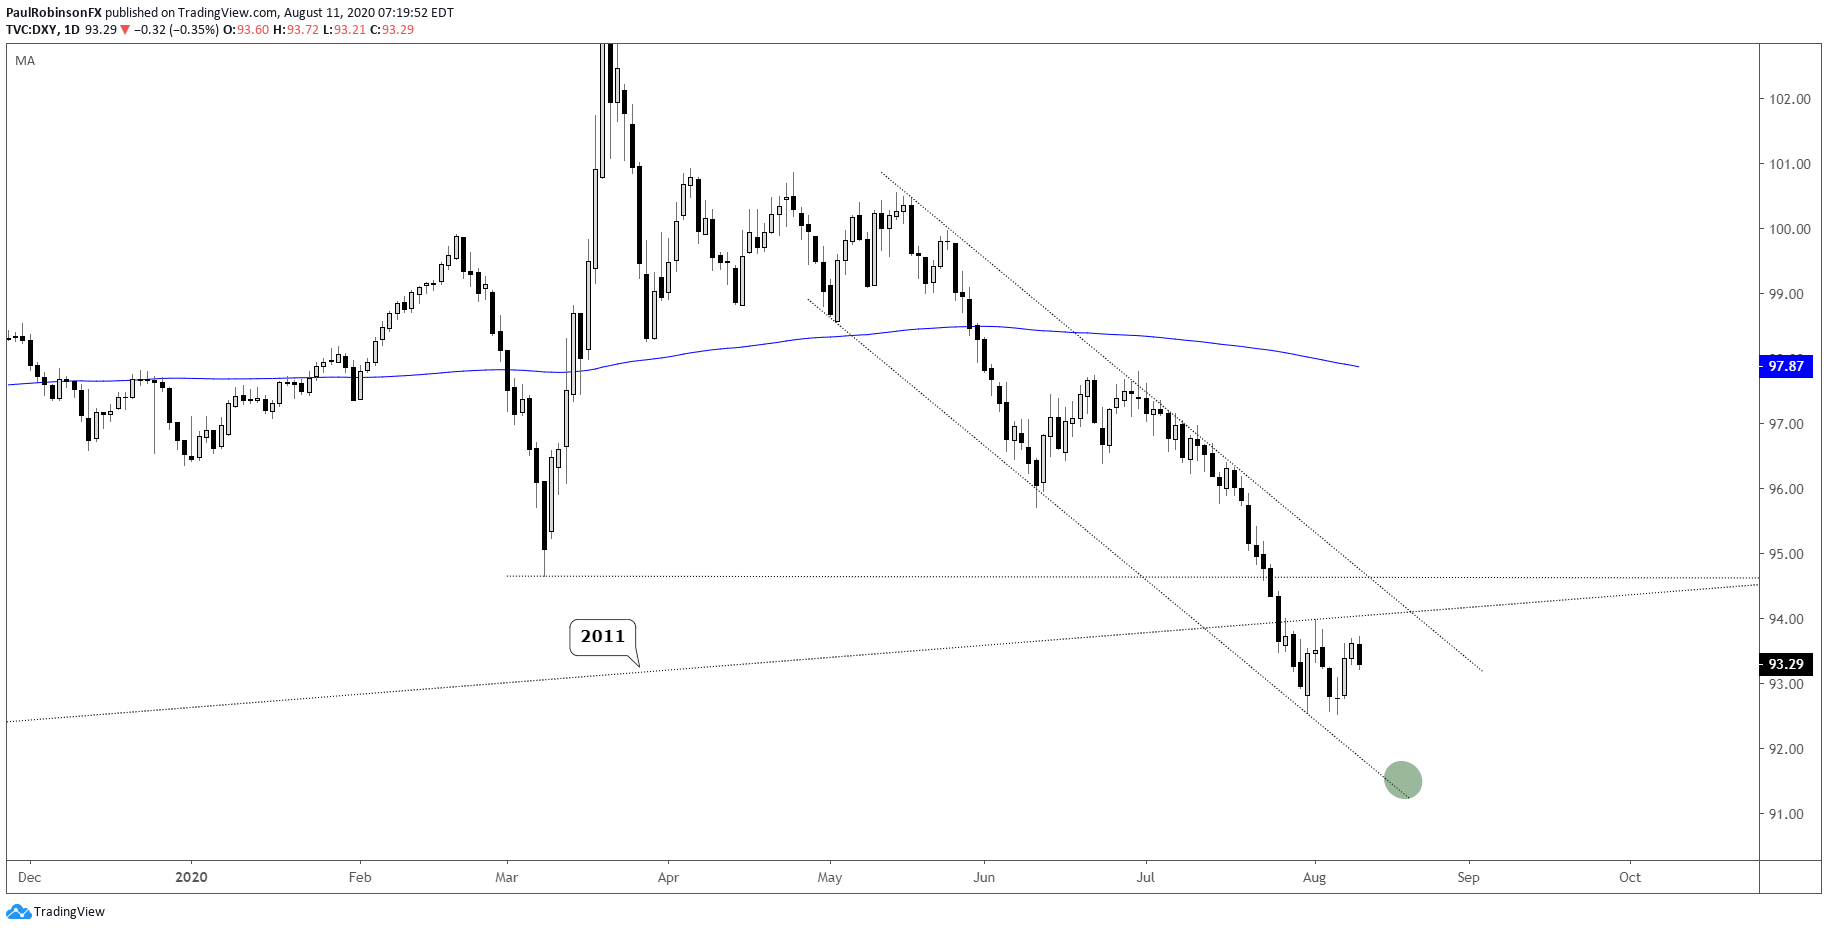
US Dollar Index (DXY) losing support from 2011
The US Dollar Index (DXY) is just below the 2011 trend-line that runs under important lows from 2014 and 2018. This puts the DXY is in a precarious position as it lacks any kind of real bullishness in response to the July decline.
The trend off the March spike-high is clearly lower with it having accelerated last month. Turning to the 4-hr time-frame we can see the nice neat channel from June/July that was broken and led to last month’s acceleration lower. The lower parallel of this structure has gone from support to resistance.
It appears the DXY could be carving out a wedge with the lower parallel of the June/July channel as part of the ceiling to this sequence. It will take a little more time to form, but if it is to come to fruition then a resolution is likely to come this week.
Looking lower, the underside parallel of the March channel is the next spot to watch on renewed weakness, with larger potential to 88, the February 2018 low. Given the separation we would be seeing from the 2011 trend-line this target is becoming increasingly likely.
On the top-side, even if the USD index starts to rally from here it has its work cut out for it if it is to break the downward sloping trend. For now, sticking with a bearish trading bias until further indications suggest to do otherwise.

US Dollar Index (DXY) Daily Chart (pointed lower on break of 2011 t-line)
U.S. Dollar Currency Index (DXY) Chart by TradingView
US Dollar Index (DXY) 4-hr Chart (Jun/Jul parallel/wedge forming)

U.S. Dollar Currency Index (DXY) Chart by TradingView
Resources for Forex Traders
Whether you are a new or experienced trader, we have several resources available to help you; indicator for tracking trader sentiment, quarterly trading forecasts, analytical and educational webinars held daily, trading guides to help you improve trading performance, and one specifically for those who are new to forex.
---Written by Paul Robinson, Market Analyst
You can follow Paul on Twitter at @PaulRobinsonFX


