


USD PRICE OUTLOOK: EUR/USD, USD/CAD, USD/JPY – US DOLLAR CHART SETUPS
- The US Dollar edged lower right after the latest jobs report revealed a modest uptick in the unemployment rate, but USD price action has since rebounded back to session highs
- A rebounding US Dollar has pushed the DXY Index to four-month highs owing largely to demand for safe-haven currencies as the coronavirus looms over global GDP growth expectations
- EUR/USD is on pace to close lower for its fifth consecutive trading day as USD/CAD approaches a major level of confluent resistance and USD/JPY bounces off technical support
USD bulls were quick to overlook a modest uptick in the US unemployment rate from 3.5% to 3.6%, which was detailed in the January 2020 NFP report released early Friday morning. The US Dollar traded on its front foot ahead of the closely-watched NFP data release and gave back most of its gains after the latest jobs report crossed the wires.
Since then, the US Dollar has rebounded handsomely with the DXY Index now trading about 0.2% higher on the day near the 98.65 mark. Although the US employment rate edged modestly higher, it could be attributed largely to the rise in the labor force participation rate from 63.2% to 63.4% and may be a silver lining out of the latest NFP report.
DXY INDEX – US DOLLAR PRICE CHART: DAILY TIME FRAME (SEPTEMBER 2019 TO FEBRUARY 2020)
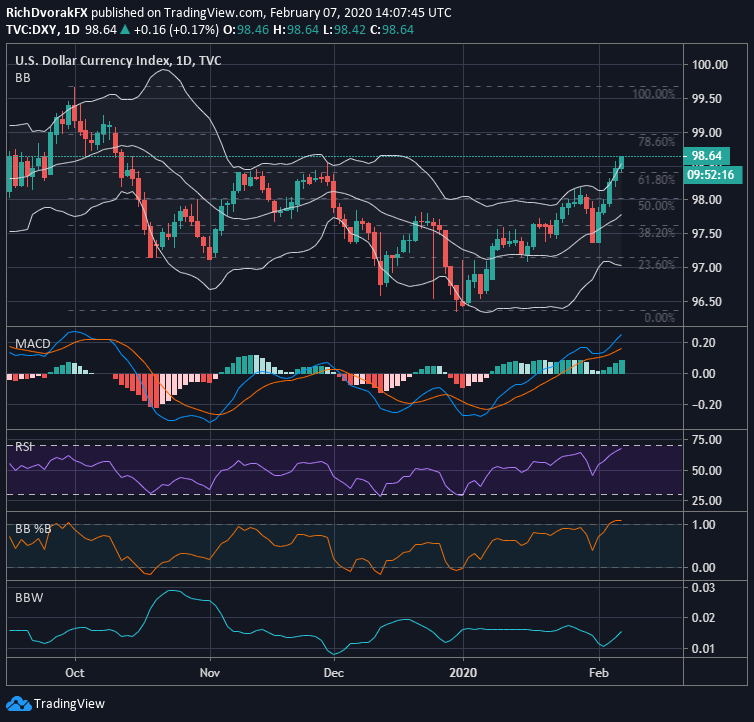
Chart created by @RichDvorakFX with TradingView
Likewise, the headline net change in nonfarm payrolls topped market expectations with a print of +225K jobs compared to the median consensus looking for +160K. Another positive factor detailed in the NFP data likely helping steer USD price action and the broader US Dollar Index higher is the fact that year-over-year average hourly earnings rebounded to 3.1% from 3.0% reported in the preceding period.

Correspondingly, the US Dollar has potential to continue its upward ascent as the DXY Index rebounds from its lowest level since July 2019 with the benchmark of major currency pairs now trading above technical resistance posed by the 98.50 area. The US Dollar could struggle to sustain its stretch higher, however, considering the DXY Index is riding the upper channel of its 2-standard deviation Bollinger Band ™.
EUR/USD PRICE CHART: DAILY TIME FRAME (JUNE 2019 TO FEBRUARY 2020)

Yet, spot EUR/USD prices continue to bleed lower as the US Dollar rises toward 2019 highs against the Euro with recent weakness likely being exacerbated by dismal German data. After sinking below the 1.1000 handle, spot EUR/USD could keep extend toward early-October lows before stabilizing, though fundamental factors like Eurozone GDP data due next week could overpower EUR/USD price action.
USD/CAD PRICE CHART: DAILY TIME FRAME (MAY 2019 TO FEBRUARY 2020)
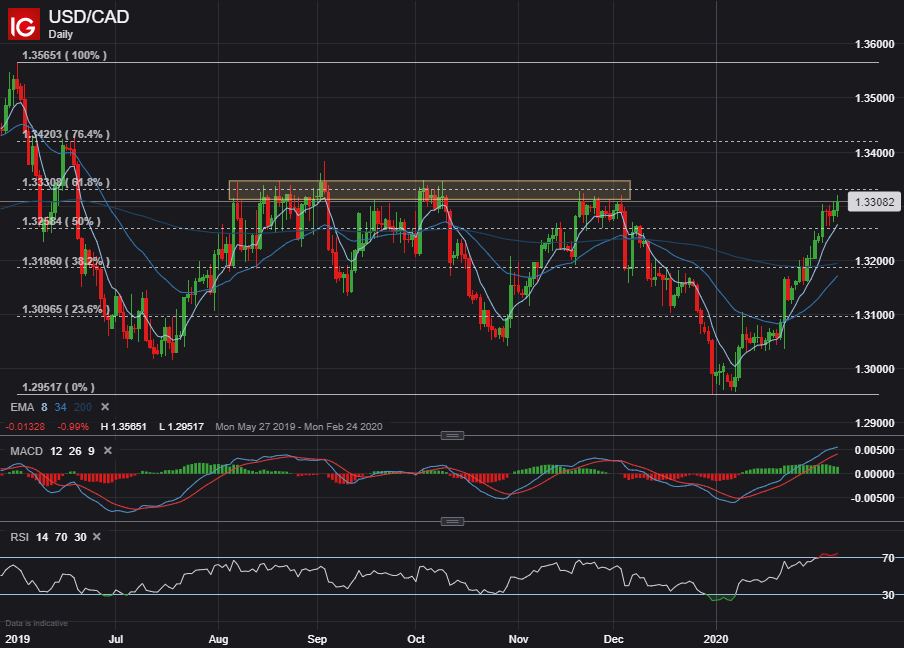
US Dollar strength since the start of the new year is epitomized by USD/CAD with spot prices surging roughly 360-pips over the last 27 trading days. USD/CAD now faces an intimidating level of technical resistance around the 1.3330 level, which has potential to send the US Dollar pivoting back lower against the Loonie.
| Change in | Longs | Shorts | OI |
| Daily | 0% | -24% | -14% |
| Weekly | 16% | -17% | -3% |
This zone of confluence is highlighted by the 61.8% Fibonacci retracement level of spot USD/CAD’s trading range etched out since May 2019. While solid Canadian jobs data could serve as a headwind to spot USD/CAD next week, price action may continue to focus on broader market impact stemming from the novel coronavirus outbreak.
USD/JPY PRICE CHART: DAILY TIME FRAME (NOVEMBER 2019 TO FEBRUARY 2020)
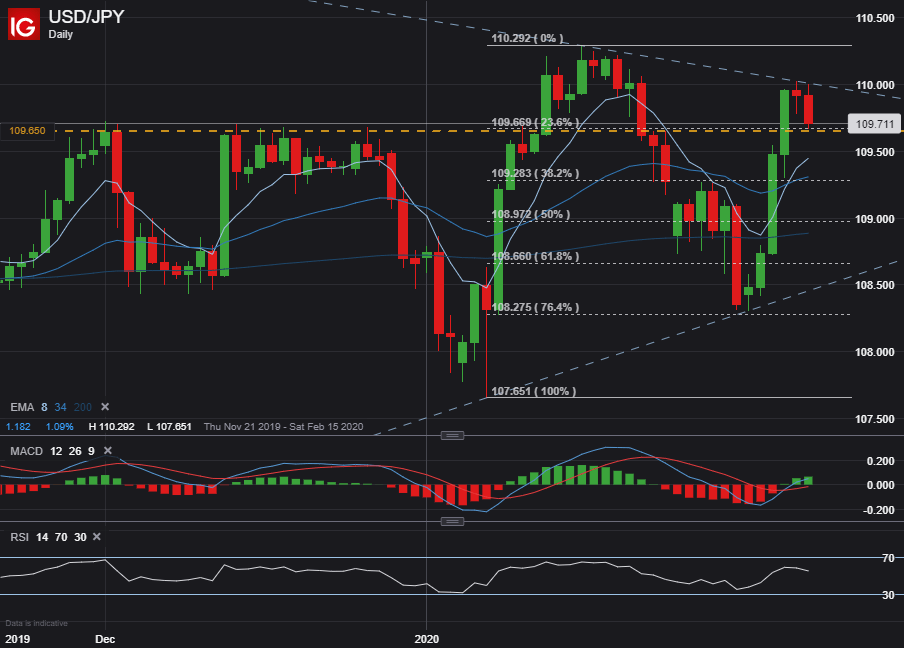
The US Dollar turned lower against the Japanese Yen despite strong NFP data overall, which hints at a general risk-off tone reverberating across the forex market. Spot USD/JPY has edged lower since running into resistance at the 110.00 handle, but the US Dollar has so far found support around the 109.65 price level. Nevertheless, coronavirus headlines may very well determine the general direction of USD/JPY.
-- Written by Rich Dvorak, Junior Analyst for DailyFX.com
Connect with @RichDvorakFX on Twitter for real-time market insight


